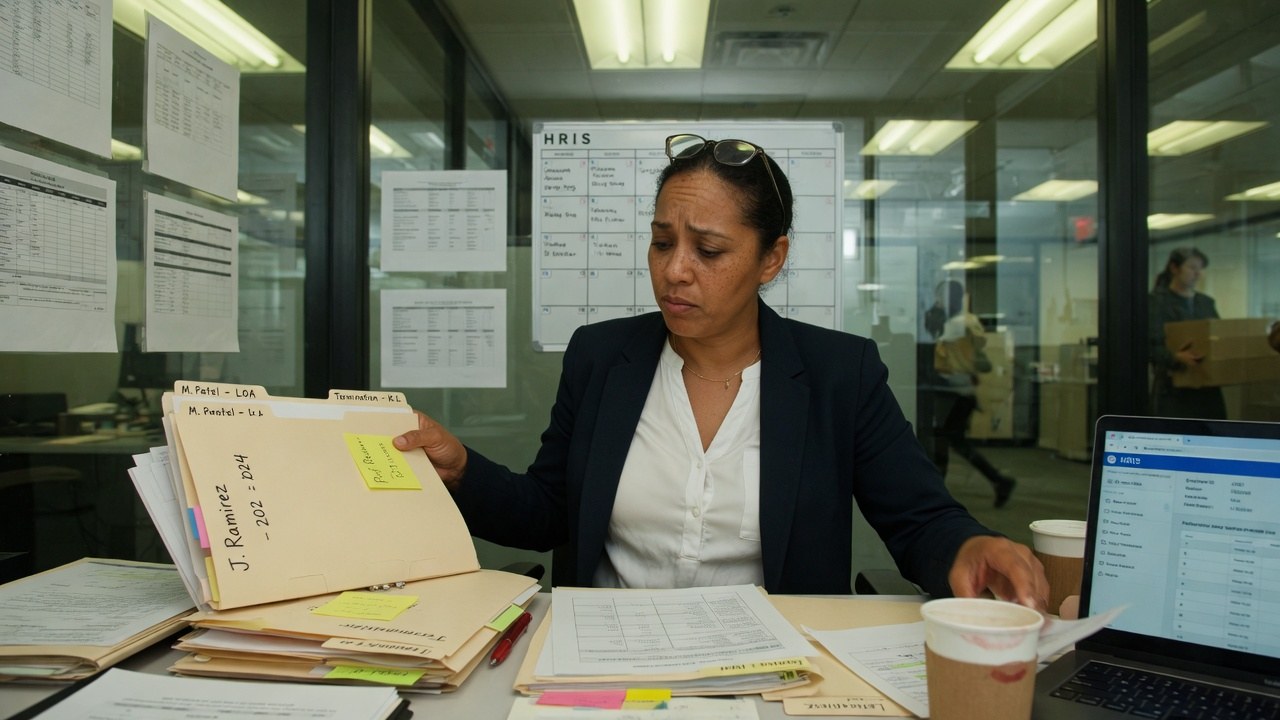
An HR business partner at a paper-covered desk working through a stack of labelled employee folders, a laptop open beside her.

CEDX People · People & HR

One roster.
Every team scored for coverage.

People is the record the rest of the estate reads: a directory where every row carries title, department, manager, status, tenure and an engagement score — with flight risk flagged per person and every team run through a bench-and-gap coverage model.

The Ask HR panel on the overview answers “How does PTO accrual work?” and ends with its source: PTO policy, section 2, updated May 2026. An answer that cites its row is one a person can check.

people.cedxsystems.com — live build
CEDX People overview: headcount 303, open roles 48, high flight risk 34, on leave 11, engagement 61 and coverage gaps 12, with root-caused alerts and a workforce health composite of 64.

Runs on demo data. The workspace names itself Northline US Inc. on screen.

303 people on the active roster285 employed · 11 on leave · 34 flagged flight risk
48 open approved requisitionsthe hiring plan the headcount chart is measured against
14 teams on the coverage modelbench multiples from 0.8× to 8×, gap scores to 100

What it is

The record, the risk, and the bench.

A directory with something on every row

303 people, 1–25 per page, with title, department, manager, status, tenure in months and an engagement score on every row — Support L2 to Controller to Sysadmin. Department tabs run Engineering, Product, Design, Sales, Customer Success, Marketing, Finance, People, and the chips split Active, On leave and Onboarding.

  • Title, manager, tenure and engagement score per row
  • Active · On leave · Onboarding as filter chips
  • CSV exports the view you were looking at
people — screen-3
A directory with something on every row

Coverage is a model, not a headcount

Fourteen teams scored on the same five columns: headcount, risk heads, bench multiple, gap score and impact. One 24-person team runs a 3× bench and still scores gap 100, Severe; another holds an 8× bench at gap 98. The model reads succession depth, not just seats.

  • Bench from 0.8× to 8× across the 14 teams
  • Gap scores 100 down to 20, impact Severe to Watch
  • Headcount by department, share of largest, beside it
people — screen-4
Coverage is a model, not a headcount

Risk flagged per person, alerts priced

The flight-risk board names a risk percentage per flagged profile — 92, 92, 84 at the top of the current view — and the alerts panel attaches a cause and a dollar figure: flight risk at $235K, a support coverage gap at $198K, 45 leave requests past the internal SLA.

  • Flight risk ≥55% flagged — 34 people in view
  • Alerts arrive as symptom → cause → fix, priced
  • Ask HR answers cite the policy section they used
people — overview
Risk flagged per person, alerts priced

Product tour

Four screens, captured from the running build.

Not a mockup and not a concept deck. This is what opens at /app/people.

people.cedxsystems.com
CEDX People Overview screen.CEDX People Employees screen.CEDX People Org screen.CEDX People Performance screen.

01 — Overview

The workforce brief, not a vanity dashboard

Headcount 303 against plan, open roles 48, high flight risk 34, on leave 11 with 45 pending approvals behind it, engagement 61 on a 0–100 scale and 12 teams with coverage gaps. The health composite reads 64, and each alert arrives root-caused and priced.

  • Six stat cards with weekly sparklines
  • Root-caused alerts: symptom → cause → fix, with $
  • Ask HR panel labelled scripted demo on screen

02 — Employees

The directory is the product

Search by name, title or email across 303 people. Every row carries title, department, manager, status, tenure and engagement — and the roster counts itself: 285 active, 34 high flight risk at ≥55%, 11 on approved absences.

  • 303 of 303 active roster in view
  • Department tabs across the eight org units
  • Engagement score as a sortable column

03 — Org

Fourteen teams, five columns each

The org screen scores every team on headcount, risk, bench, gap and impact — 303 people across 14 managers and 12 departments. The weakest coverage in view is gap 100, Severe, on a team with a 3× bench; the strongest sits at gap 20, Watch.

  • HC · Risk · Bench · Gap · Impact per team
  • 12 departments, 14 managers with direct reports
  • Filter teams or managers; CSV beside it

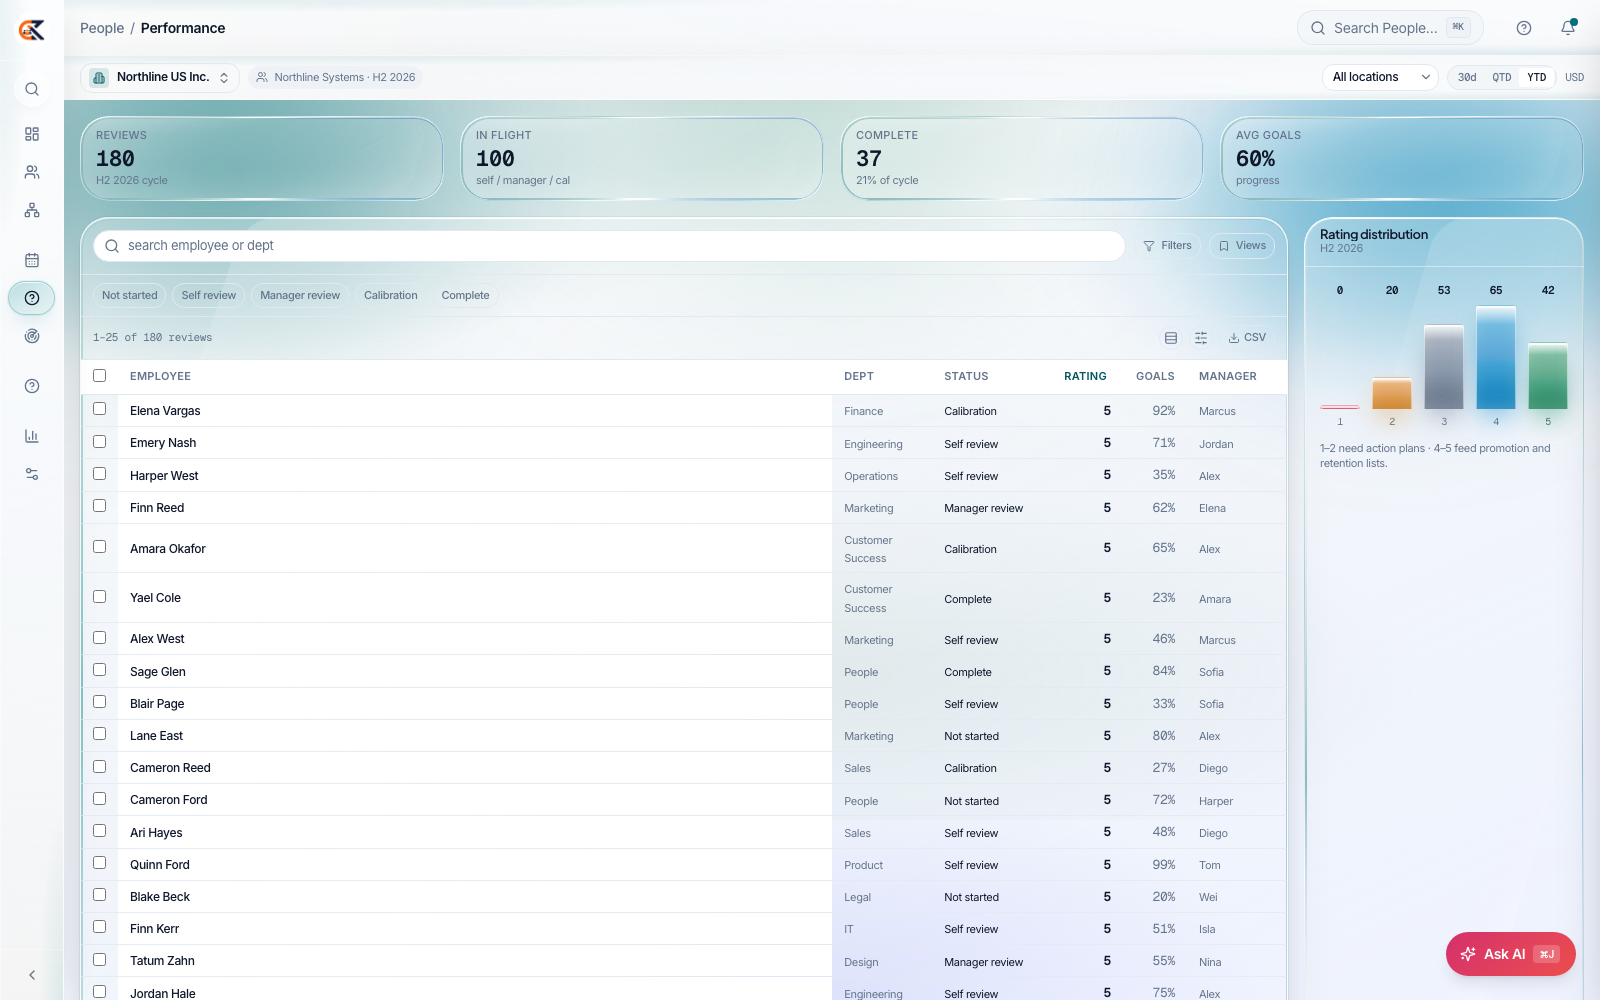
04 — Performance

The review cycle lives on the same record

180 reviews in the H2 2026 cycle — 100 in flight, 37 complete — with tabs for Not started, Self review, Manager review, Calibration and Complete. The rating distribution prints its own rule: 1–2 need action plans; 4–5 feed promotion and retention lists.

  • 180 reviews · 21% of cycle complete
  • Average goals progress at 60%
  • Rating distribution 0 · 20 · 53 · 65 · 42 in view

Who runs it

Three roles live on this record.

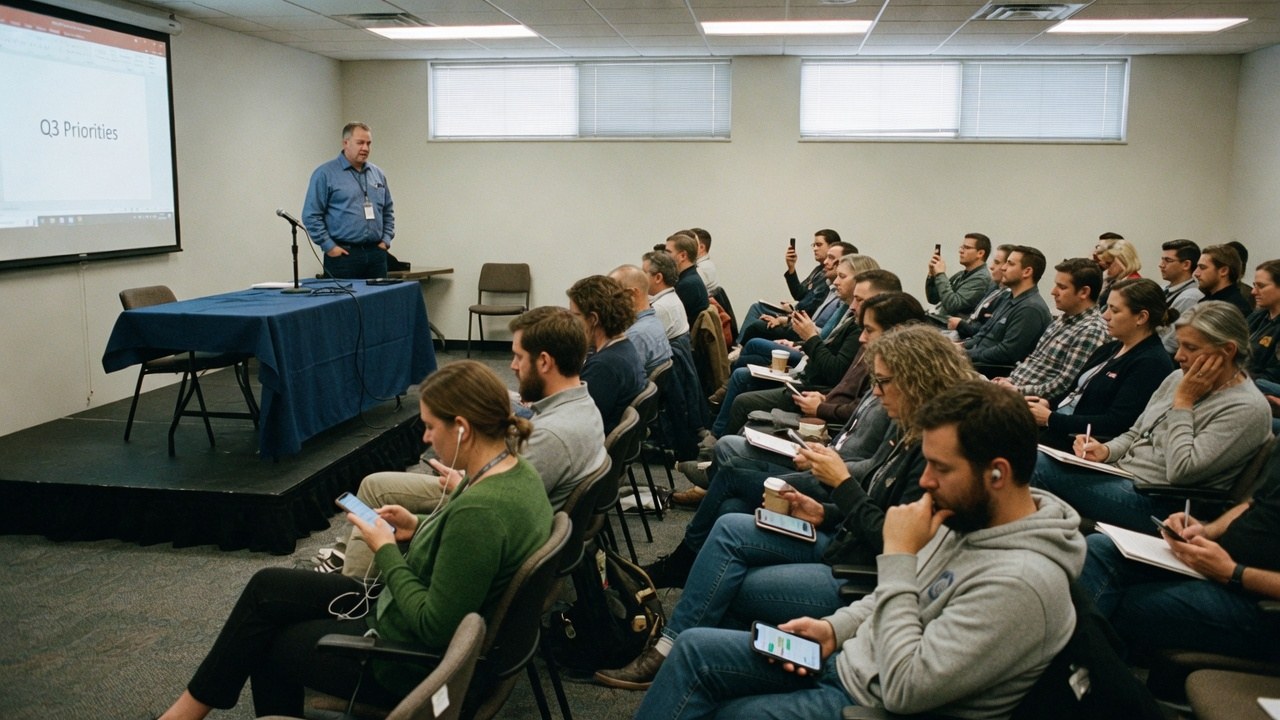
Roles, not references. We have no named customers yet, so nobody in these photographs is quoted, credited or claimed as one.

People operations

Keeps the directory true: statuses, managers, tenures. The 45 pending leave approvals on the overview are their Monday morning.

303 people · 8 departments

HR business partner

Works the flight-risk board and the coverage model — a 92 risk score or a gap-100 team is a conversation, not a chart.

34 flagged · gap to 100

Department head

Reads headcount against the hiring plan: 48 approved requisitions against a 303-person roster, by department.

48 open reqs · plan vs actual

The shape of it

What the demo workspace actually looks like.

Every figure below is legible in the captures above. Nothing here is a projection of your estate — it is the state of the demo data.

303people on the active roster285 active · 11 on leave
34flagged high flight riskrisk score ≥55% · top of board 92%
64workforce health compositeengagement 61 · gaps 12 · pending leave 45
12teams with coverage gapsgap score ≥45 · 14 teams scored
Headcount by department303 people · share of largest on the org screen
  • Engineering34
  • People34
  • Customer Success33
  • Sales29
  • Finance25
  • Product25
Highest flight risk in viewrisk % per flagged profile · attrition board
  • Engineering profile92%
  • Customer Success profile92%
  • Legal profile84%
  • IT profile82%
  • Second Engineering profile80%
Workforce health compositeengagement 61 · flight risk 34 · gaps 12 · pending leave 45
64
  • Composite 64 of 100
  • Inputs printed beside the ring on the overview

How it runs

A person record's week, in order.

01

Hire

Approved requisitions — 48 in view — sit on the overview next to headcount, so the plan and the actual are read off the same chart.

02

Score

Every person carries an engagement score, and risk ≥55% lands them on the flight-risk board with a percentage, not a colour.

03

Cover

Each team is scored on bench multiple and gap, so a 24-person team with a 3× bench still reads gap 100, Severe, when the wrong person is single-threaded.

04

Act

Alerts arrive root-caused and priced — flight risk at $235K, coverage gaps at $198K — and Ask HR answers policy questions with the section it relied on.

One record

Every people product reads
the same roster.

People is the record; the rest of the domain is what happens to it. The counts on these captures are the same 303 people.

All 132 applications

Limits

What People does not do yet.

Finding this out on the third call is worse for you than reading it here, and worse for us.

Start

Open it before you talk to anyone.

Pilot

Your roster, your policies

  • Everything in Try
  • Roster-import plan
  • Coverage-model workshop
  • Estate map
Talk to sales

Estate

People with the rest of it

  • People with Recruiting, Leave and Performance
  • One identity, one bill
  • CEDX delivery
Book an estate map

Questions

Before you pilot People.

Is the software on this page real?

Yes. Every screenshot is a capture of the running build and you can open the same build at /app/people. It runs on demo data, which the workspace labels on screen.

Where do the engagement and flight-risk numbers come from?

From the software's demo scoring over seeded records — 303 synthetic people with per-person scores. The page cites the figures because they are legible in the captures, not because we claim they predict your workforce.

What is the coverage model actually measuring?

Bench and gap, per team. The org screen shows headcount, risk heads, a bench multiple from 0.8× to 8×, a gap score and an impact band — so a team can be fully staffed and still read Severe when one person holds a role nobody else can cover.

Does Ask HR answer from our policies?

In the demo it answers from seeded policy content and prints its source — “PTO policy · §2 accrual · updated May 2026” — and the screen says the assistant is scripted. Your policies are a pilot conversation, not something we are demonstrating here.

Is People audited or certified?

No certification has been issued. What we can evidence about hosting, encryption, tenant isolation and production access is written up on the security page.

The roster is running. Go and look at it.

Live build, demo data, no card. Then check the coverage score of the team you worry about most.