Desk is ticketing built around a forecast: every open ticket carries a breach score and the signal that drove it, the queue lead sees the 51 nobody has claimed, and the deflection panel prints its own economics.
The deflection panel does its arithmetic in public: $0.99 against $6.40 per resolved outcome, 85% lower, printed next to the SLA ring it relieves. Nothing on this page asks you to take a number on faith.
desk.cedxsystems.com: live build
Runs on demo data. The workspace is the software's own demo tenant, not a customer.
201 tickets in the active queue51 unassigned, waiting to be claimed
112 forecast to breachscored ≥55% by the triage engine, signal attached
$0.99 vs $6.40assistant vs human per outcome, printed on the overview
What it is
Three screens a support lead lives in.
320 tickets, each with a clock on it
The queue sorts oldest waits first: T-1446, a password-reset ticket, sits at 19.8 hours with its first-response goal 17.8 hours past. WAIT and FRT LEFT are columns, not reports. Every row carries both, next to priority, status, assignee and org.
WAIT and FRT LEFT printed on every row
Tabs: all 320 · open 201 · unassigned 51 · breached 140
Priority and state chips, CSV of the view you filtered
desk tickets
A breach forecast, not a breach report
The triage engine scores all 201 open tickets; 112 sit at breach ≥55% and 140 have already breached: three separate counts, none of them hidden. Each row names its top signal: “queue wait 3.2h vs FRT goal 1h” is a reason you can act on.
BREACH % and TOP SIGNAL on every row
27 duplicate groups auto-clustered into their own tab
Min-breach chips: all · ≥40% · ≥55% · ≥70%
desk triage
80 articles and macros, stale ones flagged
The knowledge screen counts what agents actually reuse: 1,757 uses in 30 days, 435 deflections as self-serve hits, and 24 items flagged stale, including the reply guidelines macro agents ran 66 times last month.
Uses-30d on every article and macro
435 deflections counted, not estimated
A stale-only filter for the 24 that need a refresh
desk knowledge
Product tour
Four screens, captured from the running build.
Not a mockup and not a concept deck. This is what opens at /app/desk.
desk.cedxsystems.com
01 Overview
A shift report that argues with itself
The created-vs-solved chart carries the week's events as markers (an IdP cert rotation window in W1, a VIP policy going 24×7 in W12), so volume moves have named causes. The SLA ring says 30% of the open queue is inside its clock, and the breach list below it is sorted by risk, 95 at the top.
30% within SLA: open 201 · breached 140 · at risk 112
61% AI resolution rate beside $0.99 / $6.40 economics
Root-caused alerts: symptom → cause → fix, priced
02 Tickets
The queue, oldest waits on top
All 320 tickets in the workspace with the tabs that matter: open 201, unassigned 51, breached 140. The top of the list is a password-reset MFA ticket at 19.8 hours. The sort order is the argument for working it first.
Search by ticket, org or id
VIP flag inline on the subject, not in a separate view
Assignee column makes the 51 unclaimed obvious
03 Triage
The 112 the forecast says will breach
Every open ticket scored, the riskiest first: T-1042, an SSO login loop after an IdP rotation, sits at 95 with its FRT goal already past. The scoring model and the SLA simulator are tabs on the same screen, not a separate product.
Top signal per row: queue wait vs goal, age vs response
Duplicate groups cluster 27 repeat incidents
Forecast queue filters at ≥40 / ≥55 / ≥70
04 Knowledge
Deflection you can count
Eighty items (39 articles, 41 macros) with uses-30d, status, author and updated date on every row. The most-used macro, the chat greeting, ran 88 times in 30 days; the stale filter isolates the 24 that are quietly going wrong.
Articles 39 · macros 41 · stale 24 as tabs
435 self-serve deflections in 30 days
Draft status visible next to active
Who runs it
Three roles keep the queue honest.
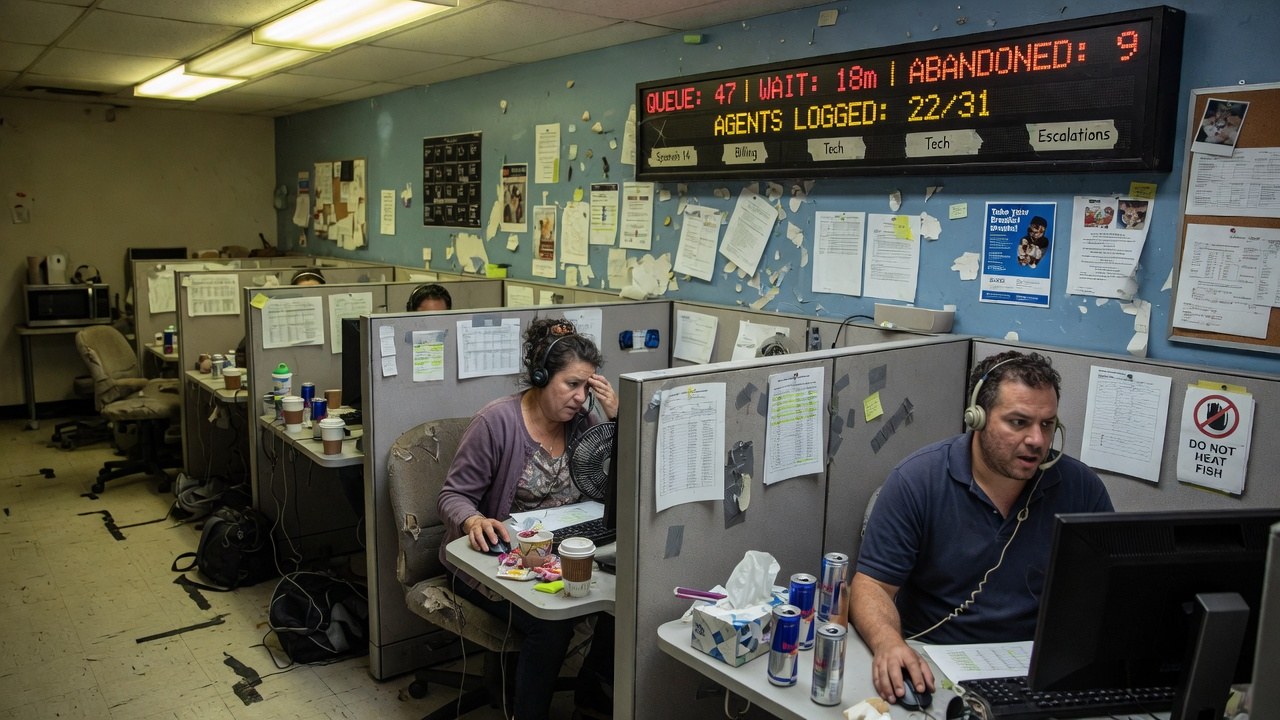
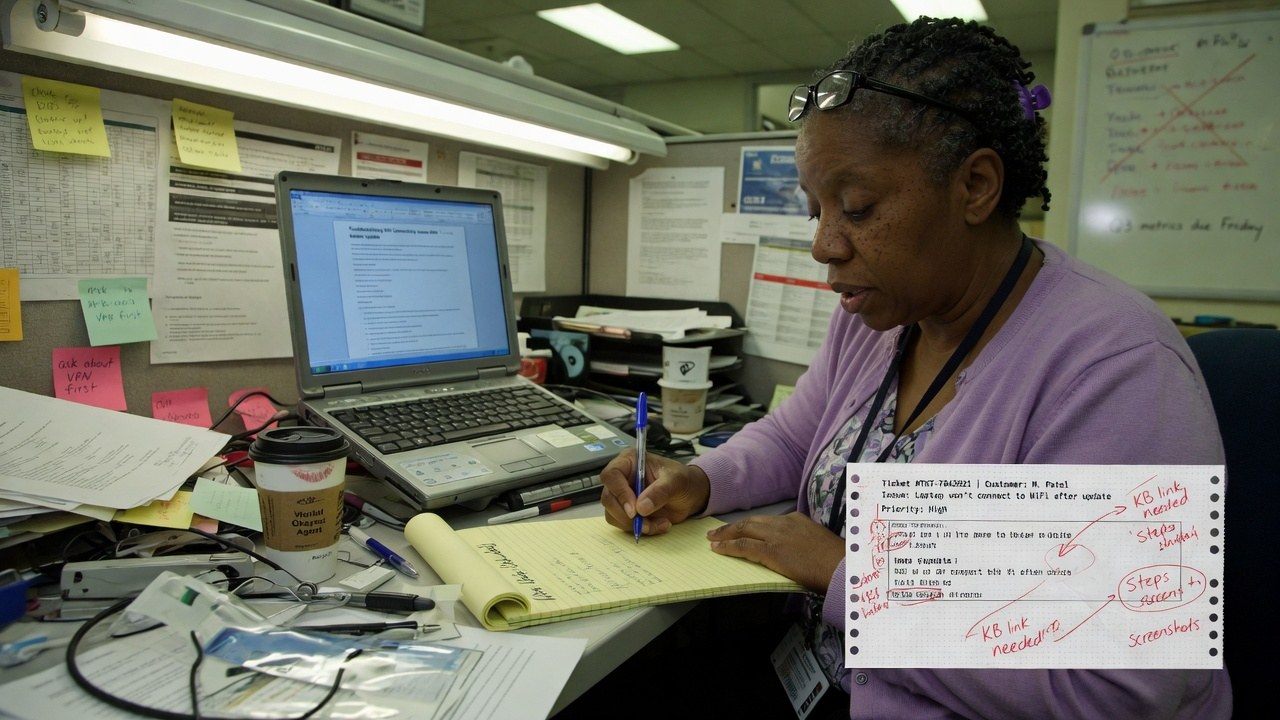
Roles, not references. We have no named customers yet, so nobody in these photographs is quoted, credited or claimed as one.
Queue lead
Owns the unassigned column and the shift handoff. The LED board version of this job is the photograph; the Desk version is the breach forecast read before standup.
unassigned · 51
Knowledge owner
Keeps the 80-item library worth reusing: retires the 24 stale items, writes against what the queue actually asks.
stale · 24
Triage and operations
Watches the forecast queue and the duplicate clusters, and retunes the scoring model when the signals drift.
forecast ≥55% · 112
The shape of it
What the demo workspace actually looks like.
Every figure below is legible in the captures above. Nothing here is a projection of your estate. It is the state of the demo data.
201tickets in the active queue140 already past an SLA clock
30%of the open queue inside SLAthe ring prints breached 140 beside it
78%CSAT on solved, surveyed tickets−1.3pp on the card this window
$0.99estimated cost per AI resolutionvs $6.40 human-handled, on screen
Open tickets by priority201 in the active queue · from the overview
Urgent60
High55
Low49
Normal37
Assistant-handled share of resolutions61% AI resolution rate · tenant rates on screen
AI resolution rate · 61%
Human-handled · $6.40 vs $0.99 per outcome
SLA health, open queueopen 201 · breached 140 · at risk ≥55% 112
30%
Within SLA · 30% of the open queue
Breached or at risk · the rest of 201
How it runs
A ticket's life, in the order it actually happens.
01
Arrive
Every channel lands in one queue: 320 tickets in the demo workspace, 201 of them open, duplicates clustered into 27 groups.
02
Score
The triage engine scores each open ticket for breach risk and prints its top signal. 112 sit at ≥55% with the reason attached.
03
Claim
Fifty-one tickets sit unassigned. The queue lead works the forecast order, not the arrival order.
04
Deflect
Knowledge does the quiet work: 435 self-serve hits in 30 days, with the 24 stale items flagged before they start lying.
One record
The queue reads what the rest of the estate writes.
Desk is not a mailbox with a database behind it. The same demo estate shows up on every screen: same workspace, same Ask AI button, same record.
Finding this out on the third call is worse for you than reading it here, and worse for us.
Desk is not generally available. What opens today is the live build running on demo data. Northline Support is the software's demo workspace, not a customer.
We have no named customers to show you, so this page shows none. The orgs on the ticket rows are demo orgs, not references.
The deflection economics ($0.99 against $6.40, 85% lower) are the demo tenant's figures as printed on screen. They are not a promise about your cost per ticket.
The breach forecast is a score, not a guarantee. The triage screen shows tickets at 95 that a person still has to work, and 140 that breached anyway.
No audit or compliance certification has been issued for Desk. What we can evidence about hosting, encryption and access is on the security page.
Yes. Every screenshot is a capture of the running build and you can open the same build at /app/desk. It runs on demo data. The workspace name on the chrome is the demo tenant, not a customer.
How does the breach forecast work?
Every open ticket gets a breach score and a top signal: queue wait against the first-response goal, age against response, and similar. The scoring model is a tab on the triage screen itself, next to the SLA simulator, so you can read what drives the number.
What happens to tickets that breach?
They stay counted. The tickets screen has a breached tab (140 in the demo), and the overview ring prints breached next to within-SLA rather than rolling them into a single green number.
Where do the AI resolution figures come from?
From the demo tenant's own panel: 61% AI resolution rate with estimated costs of $0.99 and $6.40 per outcome printed beside it. Those are the demo workspace's economics, shown because the screen shows them, not a benchmark for yours.
Is Desk audited or certified?
No certification has been issued. What we can evidence about hosting, encryption, tenant isolation and production access is written up on the security page.
The queue is running. Go and read it.
Live build, demo data, no card. Then check what your own unassigned column would look like.