The campaign room where spend answers to pipeline.
Pulse reads 82 active campaigns against the quarter's budget and the pipeline they influenced, then tells you which line is under-pacing, which audiences overlap, and what to do next, priced.
The overview does not say a channel is down. It says brand search is at 79% of planned pace, what that is worth, and where to fix it.
campaigns.cedxsystems.com, live build
Runs on demo data. The workspace, budgets and pipeline figures are the demo's.
82 active campaignsof 320 total, across 10 tracked channels
$5.85M spent QTDof a $12.5M budget: 46.8%, on screen
180 audiences, 6.87M membersoverlap risk scored on every one
What it is
Three things a campaign room has to get right.
A campaign brief that polices itself
The workspace for Q3 Ops platform, search shows a governance QA of 100, eight of eight checks passing: naming convention, utm_campaign slug matching the name, owner assigned, audience attached, budget line present. Below it, the budget line reads $60K budget, $48K spent, 80% pace, $42 cost per lead.
Governance QA 100: 8 of 8 checks pass
Channel plan split: search 66%, email 12%, partner 11%
Assets 4 of 4 ready before the schedule opens
campaigns screen-2
180 audiences with overlap priced in
6,871,492 members across always-on, retarget, lookalike, suppressed and campaign-bound segments. Every row carries size, engaged share, 30-day spend and an overlap-risk score, and 29 pairs share 60% or more of their members, which is exactly the waste the Pulse prices.
Kinds: always-on, retarget, lookalike, suppressed
Engaged share and 30-day spend per segment
29 high-overlap pairs flagged at ≥60% shared
campaigns screen-3
Ten channels, one league table
Content, event, webinar, retargeting, social, search, video, partner, email, display: each with campaigns, spend, pipeline, leads, CPL, ROAS and share of portfolio. Email returns 9.5× at $12 CPL; display sits at 4.8× and 6.7% share. The argument about the mix happens on one table.
CPL and ROAS per channel, sortable
Email 9.5× · partner 8.7× · display 4.8×
Automation coverage shown per paid channel
campaigns screen-4
Product tour
Four screens, captured from the running build.
Not a mockup and not a concept deck. This is what opens at /app/campaigns.
campaigns.cedxsystems.com
01 Pulse
Alerts that arrive root-caused and priced
Brand search is under-pacing 18%: spend at 79% of planned pace, worth $42K. Two audiences overlap 62%, worth $18K. Social demand's ROAS collapsed to 1.2×, worth $28K. Each alert carries symptom, cause and fix, and the do-this-next queue scores impact plus effort times confidence.
Symptom → cause → fix on every alert
Do-this-next queue with confidence scores
Lowest-ROAS campaigns named: win-back at 0.1×
02 Workspace
One campaign, fully accountable
Q3 Ops platform, search: objective, audience (enterprise ops directors, 45,200 members), channel plan, asset checklist, schedule and budget line in one workspace. The ledger reads budget $60K, spent $48K, remaining $12K, pace 80%, cost per lead $42.
Objective and audience at the top of the brief
Asset checklist 4 of 4 ready, owners named
Budget line straight from the spend ledger
03 Audiences
See the overlap before you pay for it
Enterprise supply VPs who skipped the webinar: 57,162 members, 36% engaged, $31K spent in 30 days, overlap risk 73. Suppressed segments sit in the same list at $0 spend, so what you are not buying is as visible as what you are.
Engaged % and overlap risk on every row
Suppressed segments visible at $0 spend
CSV export of the filtered view
04 Channels
Where the portfolio actually earns
Content leads spend at $742K across 35 campaigns; partner leads efficiency at 8.7× ROAS and $8 CPL on 64,345 leads. The spend-share rail and the table tell the same story, so nobody argues from two different charts.
$5.85M portfolio spend, $149.1M influenced
10 channels with spend, pipeline and leads
Spend share ranked beside the table
Who runs it
Three roles keep the room honest.
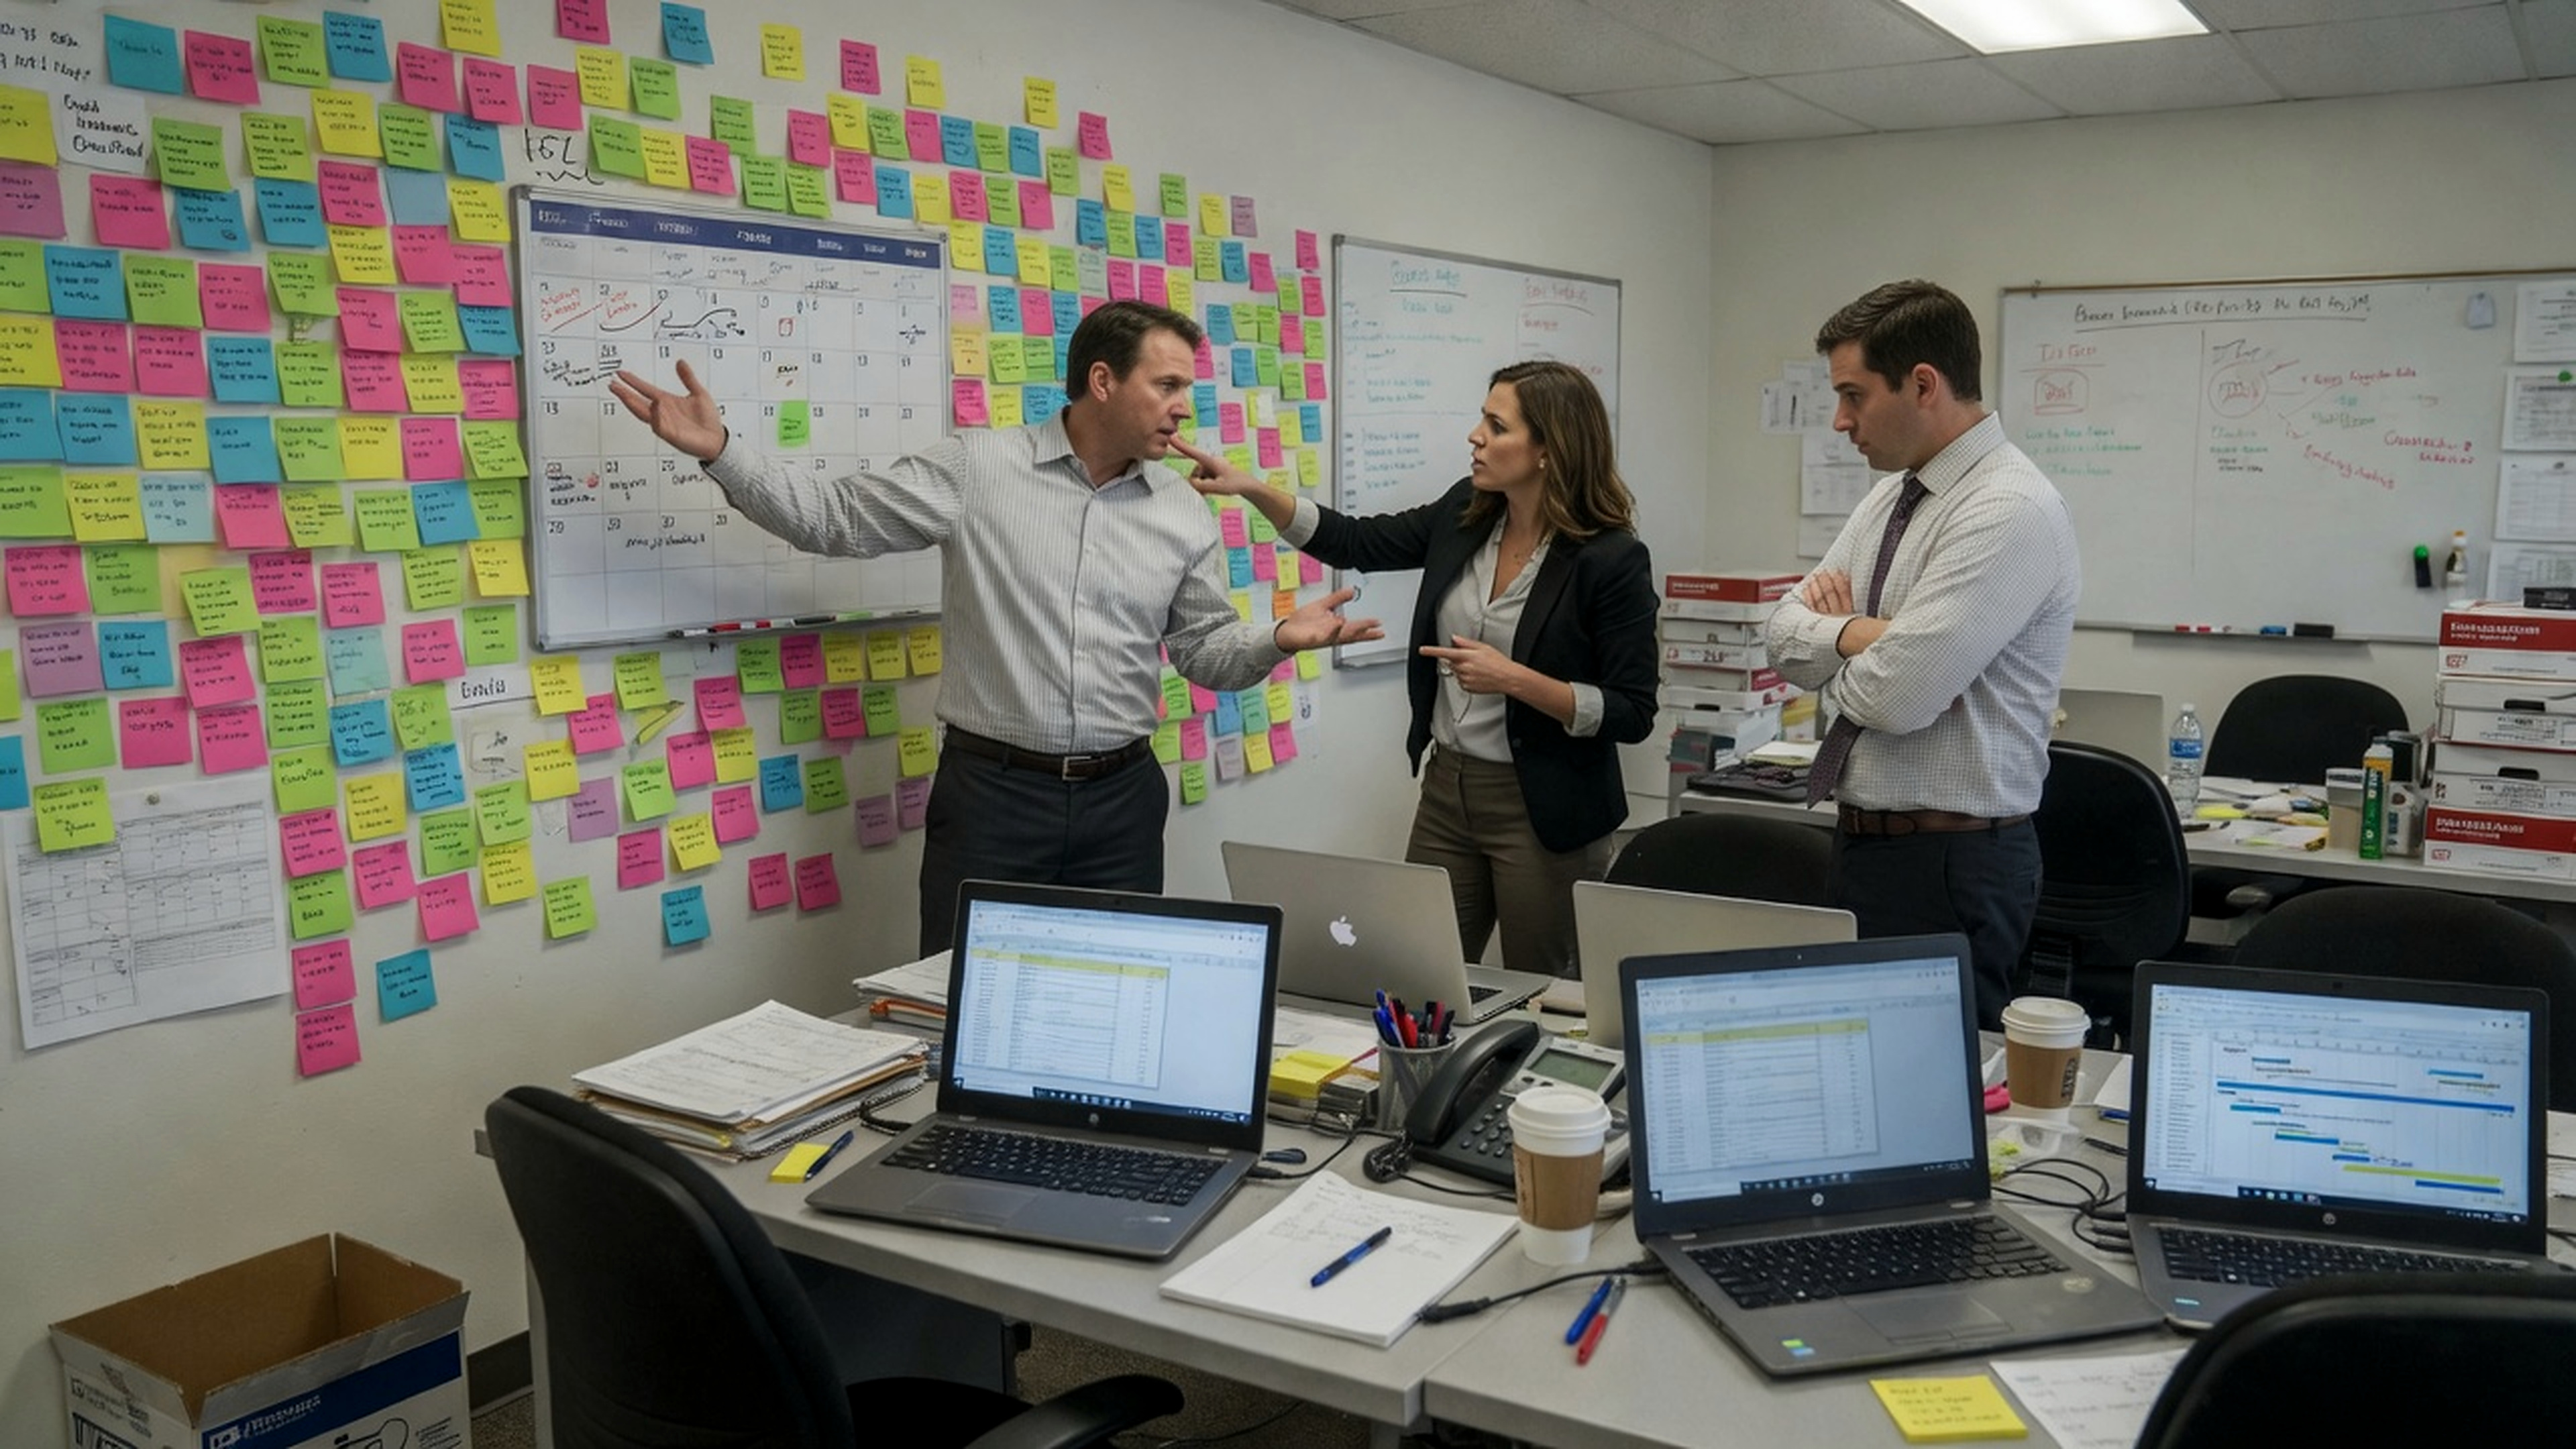
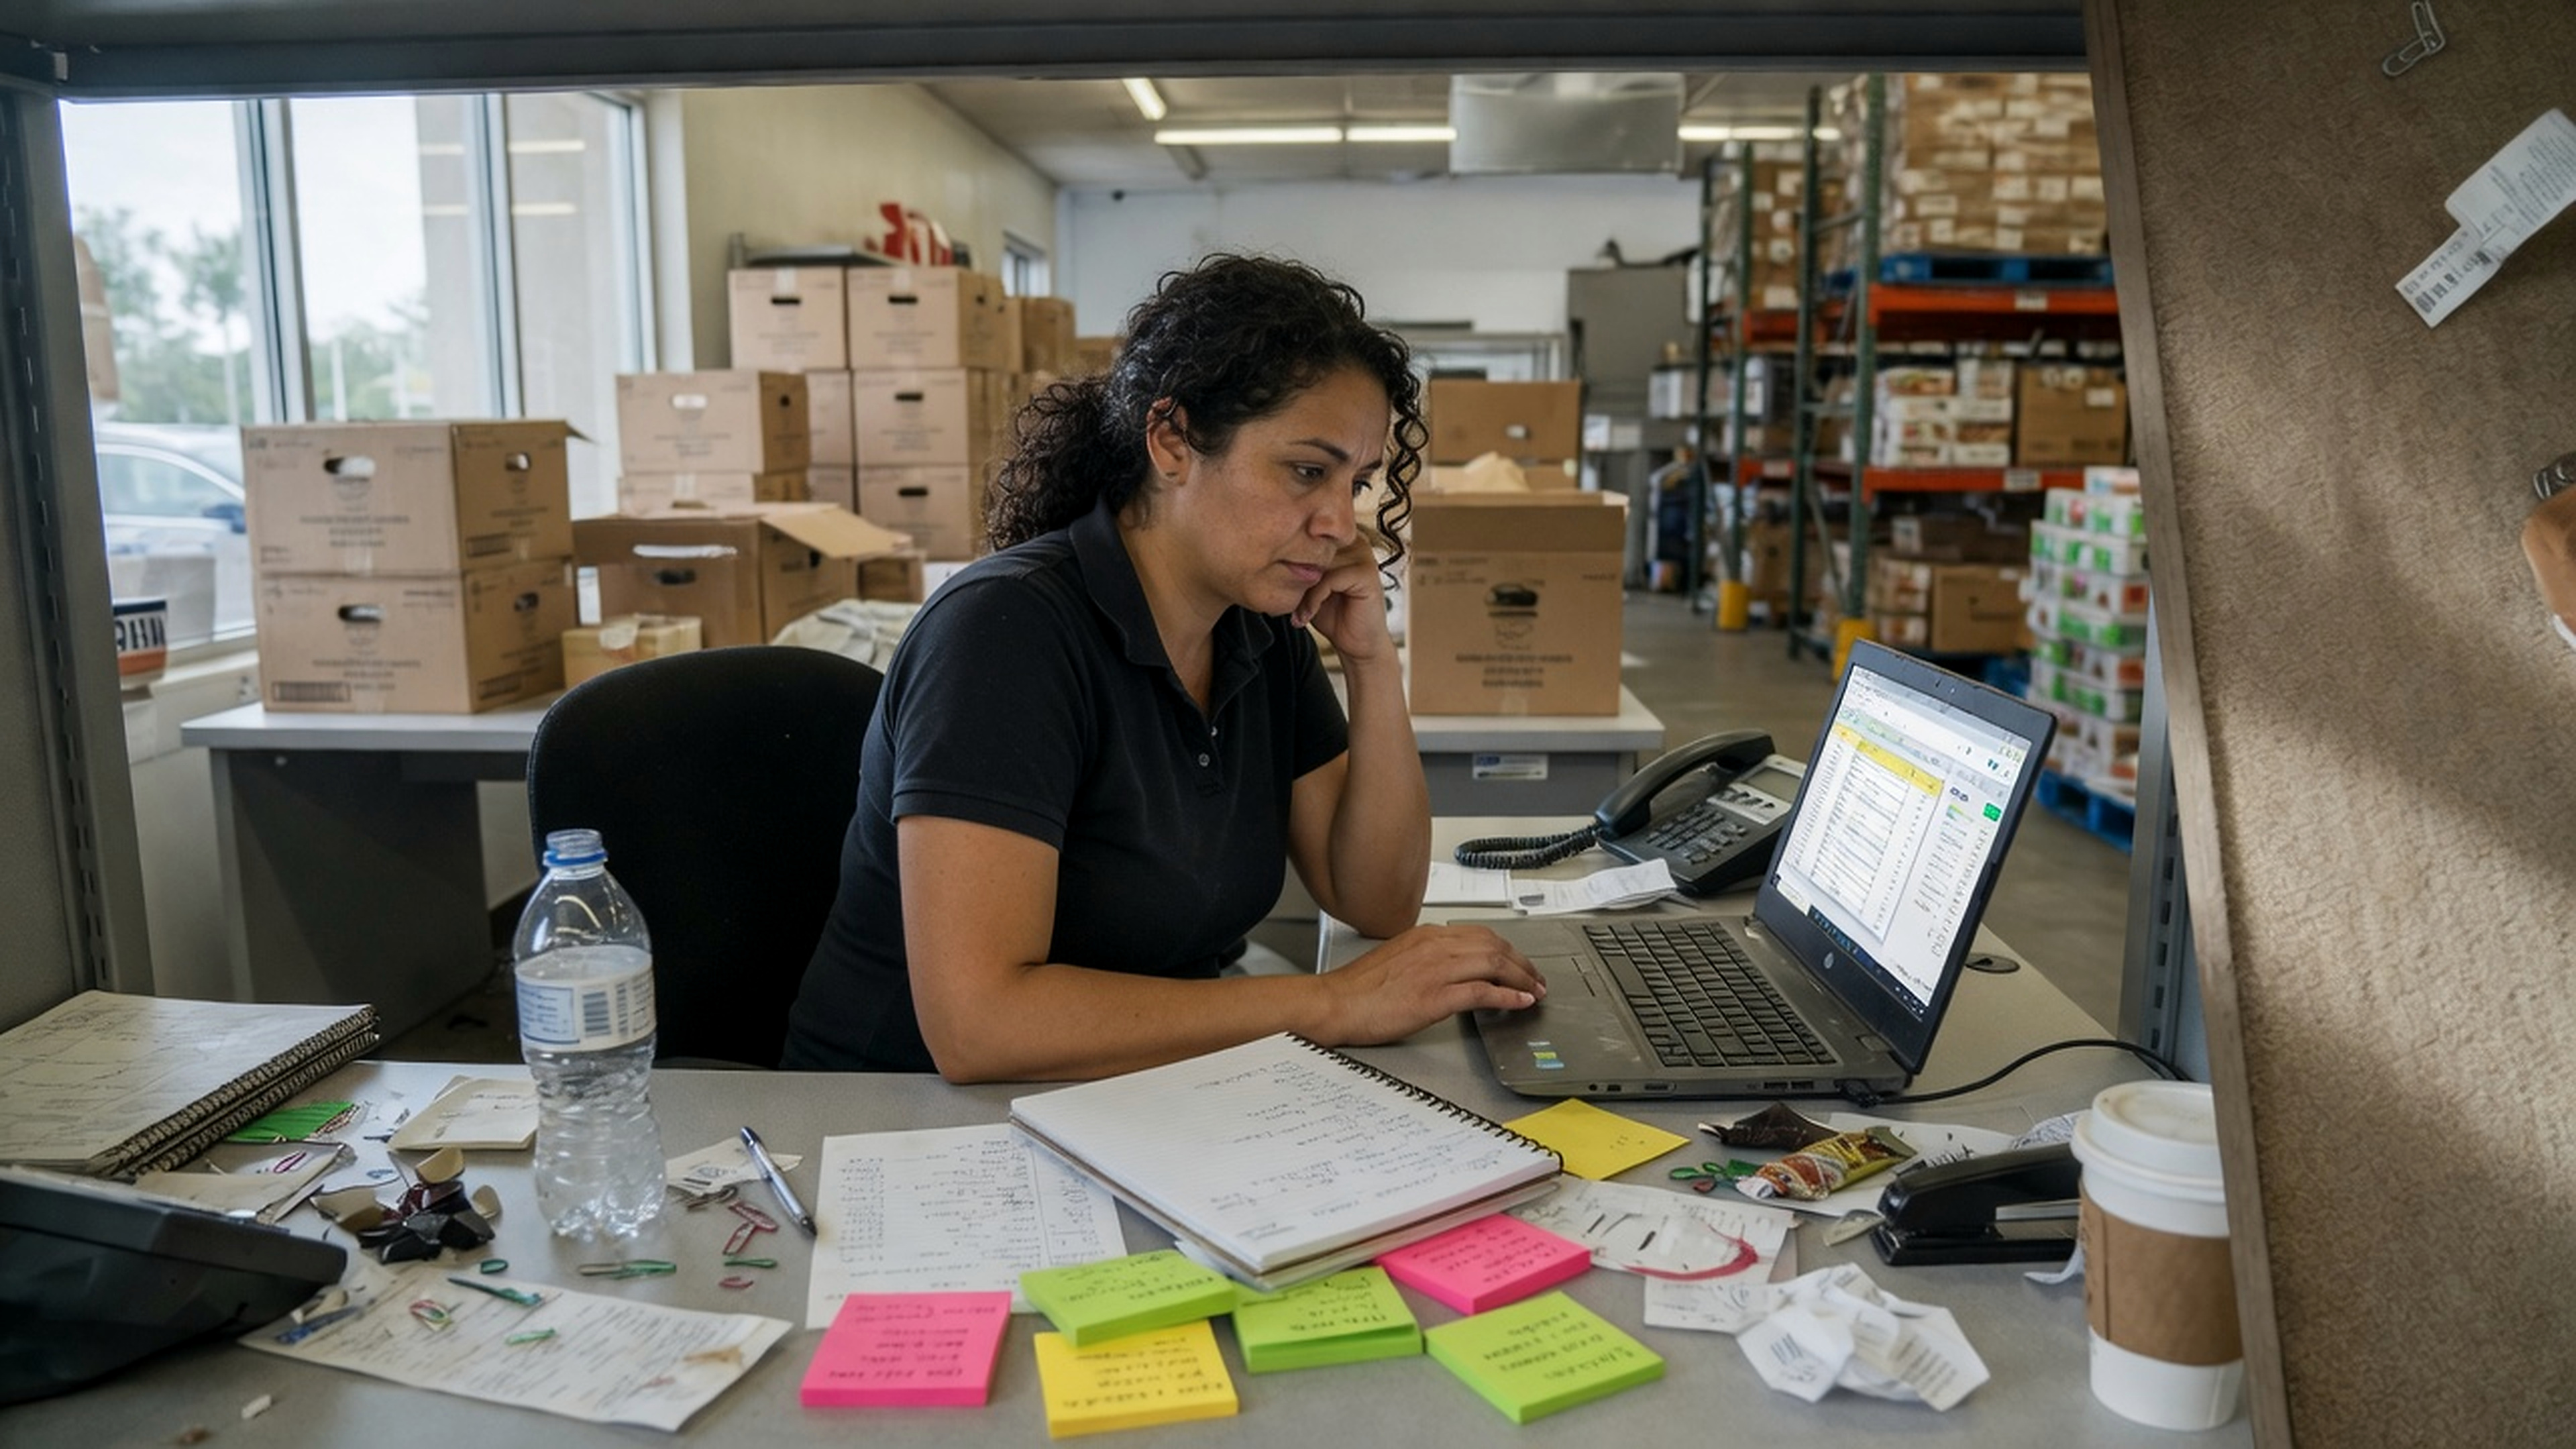
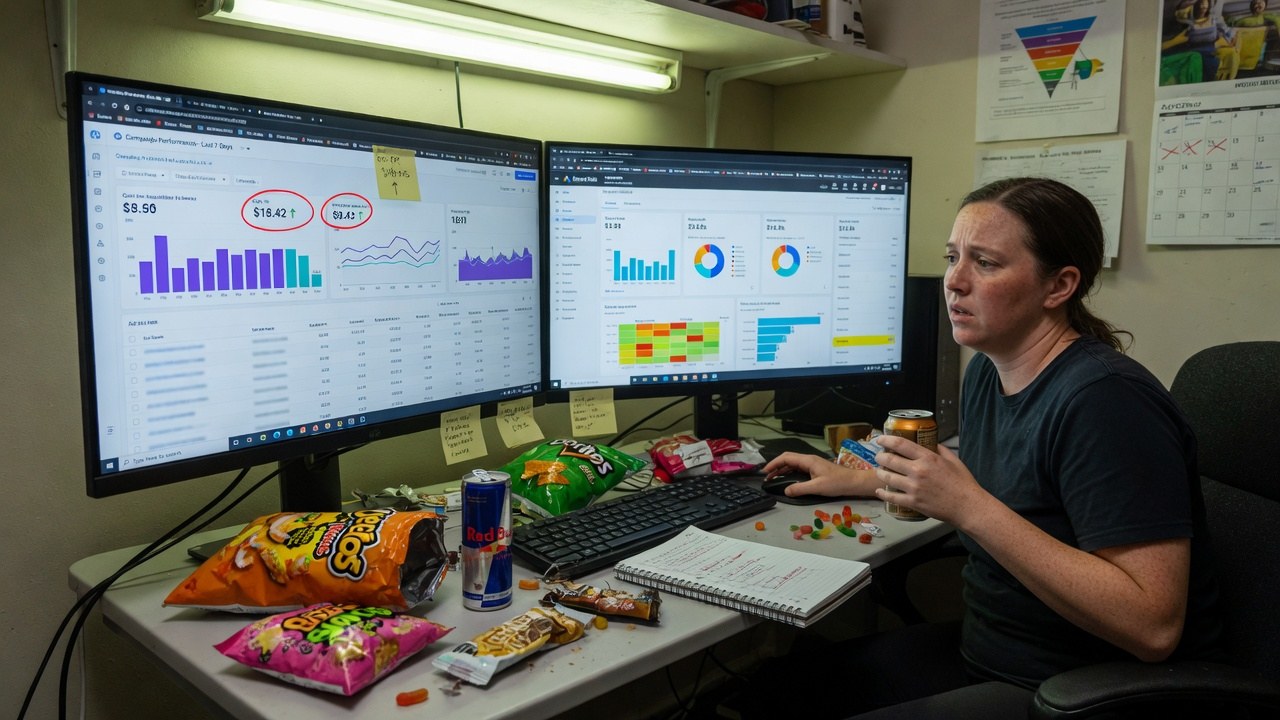
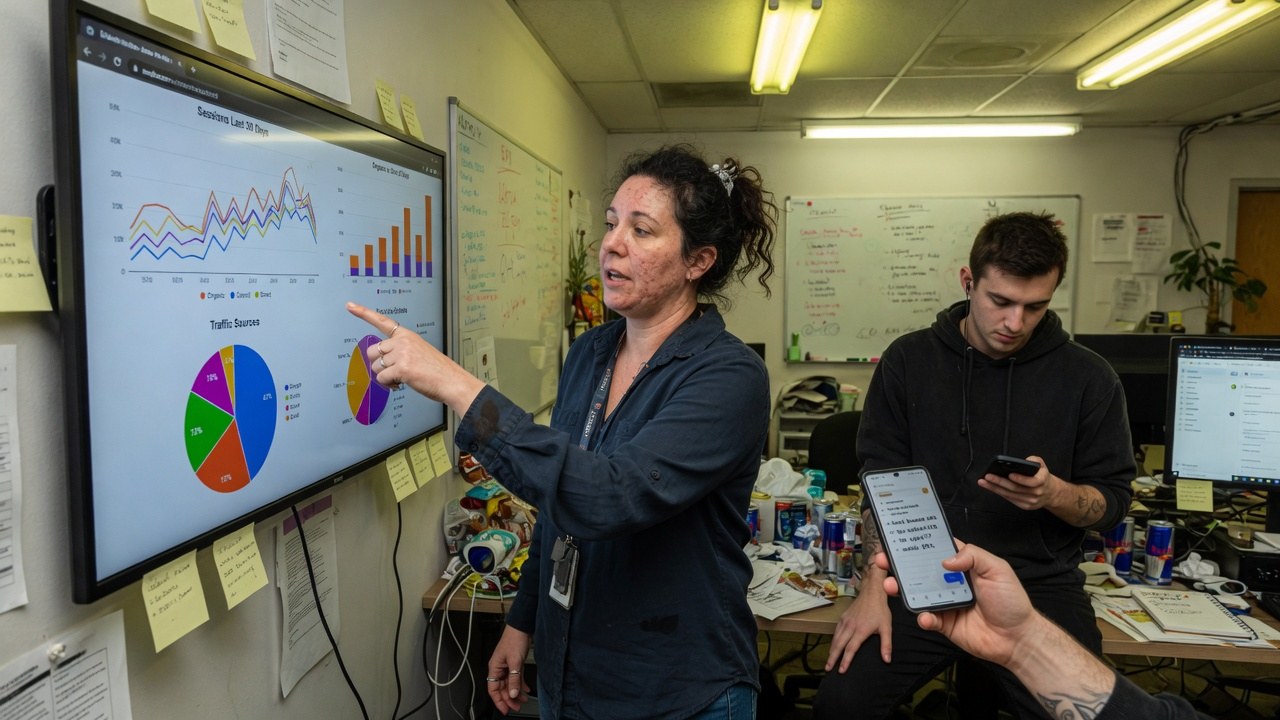
Roles, not references. We have no named customers yet, so nobody in these photographs is quoted, credited or claimed as one.
Demand-gen lead
Owns the Pulse: which of the 82 active campaigns earns its budget line, and which alert gets worked first.
82 active · 40 under-pacing
Channel owner
Lives on the channel table: CPL, ROAS and share per channel, and the pace bar that says a line is drifting before the quarter does.
10 channels · CPL from $8
Marketing ops
Keeps governance green: naming conventions, UTM defaults, audiences attached, budget lines present. 8 of 8 checks, every campaign.
governance QA · 8 of 8
The shape of it
What the demo workspace actually looks like.
Every figure below is legible in the captures above. Nothing here is a projection of your estate. It is the state of the demo data.
82active campaigns in view320 total · 10 channels
$5.85Mspend QTDof $12.5M budget · 46.8%
$149.1Mpipeline influencedblended ROAS 7.2×
29high-overlap audience pairs≥60% shared members
Root-caused alerts, priced on screensymptom → cause → fix · current queue
Brand search under-pacing 18%: spend at 79% of planned pace on brand terms$42K
Social demand ROAS collapsed to 1.2×: revenue ÷ spend below blended average$28K
Email nurture at 6.3× ROAS with room to scale$24K
Audience overlap 62%: ops directors × lookalike share most members$18K
Display ABM cluster idle: campaign paused with pipeline stranded$17K
Quarter budget used$5.85M of $12.5M · QTD
Spent · $5.85M
Remaining · $6.65M
Pace vs plan, one campaignQ3 Ops platform, search · $48K of $60K
80%
Spent · $48K against the budget line
Remaining · $12K, CPL holding at $42
How it runs
A campaign's life, in the order it actually happens.
01
Brief
Objective, audience and channel plan are set in the workspace before a dollar moves: 45,200-person audience attached, budget split by motion.
02
Check
Governance QA runs eight checks (naming, UTM defaults, owner, audience, budget line) and the campaign does not read ready until 8 of 8 pass.
03
Run
Channels spend against the budget line. Pace, CPL and ROAS update on the same row, so drift shows up as a number, not a surprise.
04
Correct
The Pulse raises root-caused alerts with prices attached, and the do-this-next queue ranks the fix by impact plus effort times confidence.
One record
Campaigns reads the record the estate already keeps.
Audiences, journeys, creative and analytics are not four more tools to reconcile. They are the same workspace's other views of the same people and money.
Yes. Every screenshot is a capture of the running build and you can open the same build at /app/campaigns. It runs on demo data: the budgets and pipeline figures belong to the demo workspace.
What stops a campaign launching half-built?
The governance QA in the workspace. Eight checks (naming convention, UTM defaults, owner assigned, audience attached, budget line present and more) and the brief does not read ready until 8 of 8 pass.
How does it find wasted spend?
Two ways visible in the captures: audience overlap is scored per segment, with 29 pairs sharing 60% or more of their members; and the Pulse prices under-pacing and collapsed lines in dollars, not in chart dips.
Where do the pipeline figures come from?
From the demo workspace's ledger: the Channels screen shows pipeline influenced next to spend, leads and CPL for each of the 10 channels. On your estate the same columns would read your accounts.
Is Campaigns audited or certified?
No certification has been issued. What we can evidence about hosting, encryption, tenant isolation and production access is written up on the security page.
The campaign room is running. Go and look at it.
Live build, demo data, no card. Then ask it which of your lines would show up under-paced.