Performance runs the whole cycle (goals, check-ins, reviews, calibration) and scores its own health: completion risk per packet, ratings inflation per calibration group, and a distribution that prints what each band is for.
The rating distribution prints its own rule under the bars: 1-2 need action plans; 4-5 feed promotion and retention lists. A scale that says what it is for is a scale people can argue about honestly.
performance.cedxsystems.com, live build
Runs on demo data. The cycle names itself H2 2026 Merit on screen.
320 reviews in cycle26% complete · 44 at high completion risk
210 goals trackedaverage progress 50% · 96 need attention
180 check-ins in 3 weeks44 submitted · 94 late or missed · pulse 3.1
What it is
Goals, reviews, and the calibration that checks both.
Every packet knows its stage and its risk
Three hundred twenty review packets across Not started, Self review, Peer review, Manager review, Calibration, Shared and Complete, with rating, goals progress, due date and manager per row. Forty-four carry a completion-risk score of 50 or higher.
Stage tabs across the full cycle
Rating distribution 0 · 18 · 70 · 68 · 14
Row click opens the packet inspector
performance screen-2
Goals with weight, type and an honest status
Two hundred ten goals typed OKR, Individual, Team or Development (“Enterprise pipeline $4.2M”, “Stabilize on-call”, “Document runbooks”), each with progress and weight. Statuses include Dropped, because some goals should die in the open.
Average progress 50% across all types
96 at risk or behind · 77 on track or complete
Progress and weight sortable per goal
performance screen-3
Check-ins with a pulse, not a formality
One hundred eighty weekly check-ins over three weeks: 44 submitted, 94 late or missed, average pulse 3.1 on a 1-5 scale. The late column counts days, so a missed week is a nudge, not a surprise at review time.
24% submitted in the current window
Pulse 1-5 averaged per person
Late and missed counted separately
performance screen-4
Product tour
Four screens, captured from the running build.
Not a mockup and not a concept deck. This is what opens at /app/performance.
performance.cedxsystems.com
01 Overview
The cycle's own health, scored
Cycle health sits at 42, built from 26% complete, 44 high completion risk, 5 bias flags, 53 packets in calibration and a 3.5 average rating. Alerts name the risk: a self review unstarted with the deadline inside a week; calibration inflation at mean 4.04 against an org 3.5.
Completion versus target, weekly
Risk board with stage and score per person
Bias flags aged, oldest 24 days
02 Reviews
The packet pipeline
Search by employee, department or manager across 320 packets. The distribution panel reads 0, 18, 70, 68, 14 across the five bands and prints what the bands mean: action plans at the bottom, promotion and retention lists at the top.
44 packets at completion risk ≥50
Average rating 3.5, rated packets only
CSV of the filtered cycle
03 Goals
Where the work is written down
Two hundred ten goals sorted by progress, from 99% down to the stalled. Type chips split OKR, Individual, Team and Development; status runs On track, Behind, At risk, Dropped and Complete.
96 goals flagged need attention
Weight per goal, visible on the row
Owner on every goal
04 Check-ins
The weekly drumbeat
One hundred eighty check-ins with week, status, pulse, priority, manager and days late per row. Submitted, Late, Missed and Draft are tabs, so the 94 needing a nudge are one click from a list.
Pulse averaged 3.1 across the window
Six days late at the top of the board
Manager per row, so the nudge has an address
Who runs it
Three roles carry the cycle.
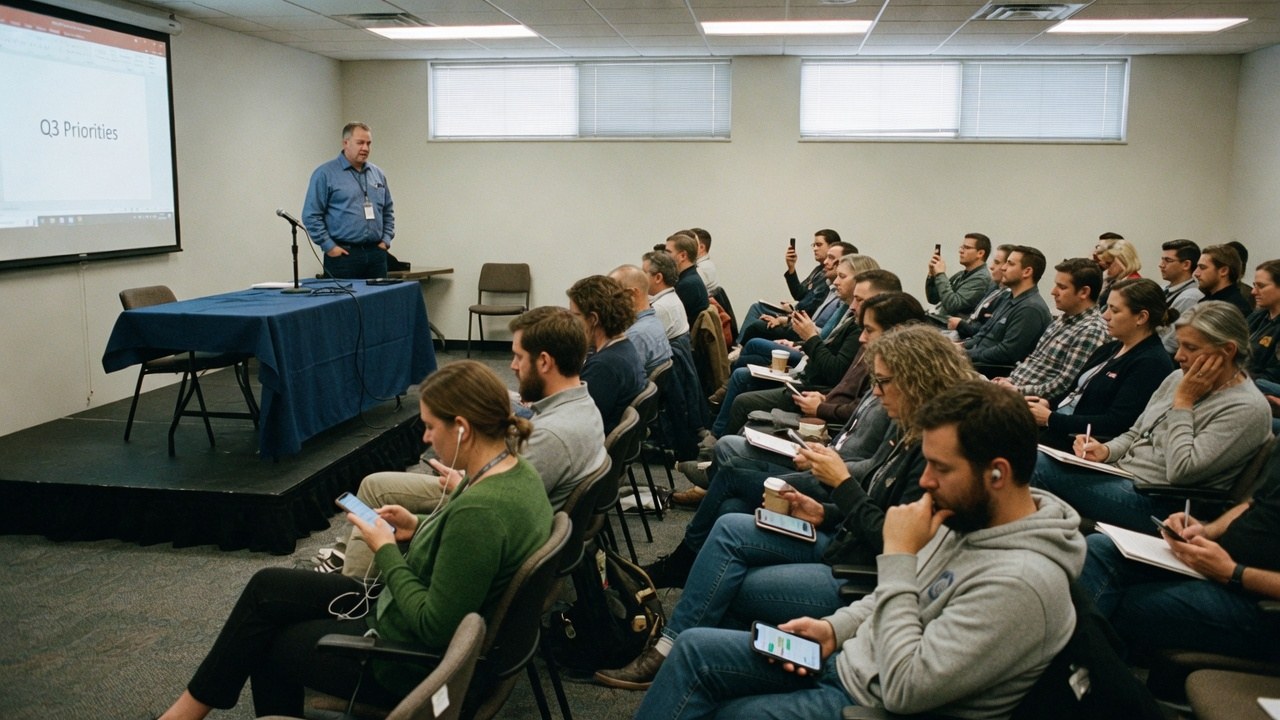
Roles, not references. We have no named customers yet, so nobody in these photographs is quoted, credited or claimed as one.
Team member
Writes the self review and the weekly check-in, and sees goals progress on the same row as the rating.
pulse 3.1 · goals 50%
HR business partner
Watches cycle health: completion risk, the 53 packets in calibration, and the bias flags before they become arguments.
health 42 · 5 bias flags
Calibration facilitator
Runs the room where mean 4.04 against org 3.5 is a slide, not a whisper. Inflation is a number on screen.
53 packets · mean 4.04 vs 3.5
The shape of it
What the demo workspace actually looks like.
Every figure below is legible in the captures above. Nothing here is a projection of your cycle. It is the state of the demo data.
320reviews in the H2 2026 Merit cycle26% complete · 83 packets
3.5average rating1-5 scale · rated packets only
44packets at high completion riskrisk score ≥50
5calibration bias flagsinflation mean 4.04 vs org 3.5
Rating distributionH2 2026 Merit · rated packets
Rated 3: solid70
Rated 4: strong68
Rated 2: needs support18
Rated 5: exceptional14
Rated 1: action plan0
Check-in submission44 submitted of 180 due in three weeks
Yes. Every screenshot is a capture of the running build and you can open the same build at /app/performance. It runs on demo data, which the cycle labels on screen.
What is completion risk?
A score per review packet that flags work likely to miss the cycle: 44 packets at 50 or higher in the demo, with the stage and score on the risk board. The top alert is a self review unstarted with the deadline inside a week.
What do the bias flags catch?
Calibration drift, shown as numbers: the demo alert is a group whose mean rating is 4.04 against an org-wide 3.5. It is an analytics flag, not a fairness certification.
How do check-ins relate to reviews?
Check-ins are the weekly pulse (submitted, late, missed, with a 1-5 score) and reviews are the cycle packets. In the demo, 94 late or missed check-ins are the nudge list that keeps the cycle honest.
Is Performance audited or certified?
No certification has been issued. What we can evidence about hosting, encryption, tenant isolation and production access is written up on the security page.
The cycle is running. Go and look at it.
Live build, demo data, no card. Then check how many of your own reviews would be flagged at risk today.