Pulse reads 21 live journeys against enrolment, conversion and drop, then goes further: the wait cost of a slow path, in dollars, and the exact step where 35.7% of a win-back path walks away.
A drop rate next to a step name is a to-do list. A wait cost in dollars is a budget conversation. This product prints both.
journeys.cedxsystems.com, live build
Runs on demo data. The workspace, paths and revenue figures are the demo's.
21 live journeysof 40 paths · 213K enrolled, 22,868 active now
23.2% average conversionagainst a 26.2% average drop on live paths
$5.30M attributedagainst a $2.40M target, the ring reads 100%
What it is
Three things lifecycle tooling has to show you.
The path, with drop on every edge
The cart-recover canvas reads like a flow and measures like a ledger: 18,420 enrolled, entry on cart abandoned, wait one hour, email reminder one, wait 22 hours, an SMS urgency step, then a split on engaged, 71% yes, 29% else. Every edge carries its drop count.
9 nodes from entry to exit, drop per edge
12% conversion · $412K attributed on this path
Read-only canvas: click a node for its inspector
journeys screen-2
328 steps, ranked by how much they leak
Every step across every path in one table: type, entered, dropped and drop rate. Wait 72h loses 37.4% of the 4,932 who reach it. The win-back email we miss you has dropped 7,900 of 22,100, and the salvage score says it is still worth fixing.
Step mix: 36 email, 35 wait, 32 push, 32 split
Entered, dropped and drop % per row
Filter chips by type: email, SMS, wait, split, push
journeys screen-3
An enrollment ledger, not a black box
320 enrollments with the person, the journey, the status, the step they are on, days in path, the exit reason and LTV. Exited on a suppression list, failed on a channel opt-out, completed on goal met. The reason is a column, not a mystery.
Exit reasons: suppression list, opt-out, hard bounce
Days in path and LTV on every row
journeys screen-4
Product tour
Four screens, captured from the running build.
Not a mockup and not a concept deck. This is what opens at /app/journeys.
journeys.cedxsystems.com
01 Pulse
The program brief, with wait cost in dollars
The root-caused alerts do not say engagement is down. They say a five-day wait on the win-back path costs $1.79M in opportunity, that the payment-fail SMS experiment won by 15.2 points, and that the Q3 holdout cohort locks in week 11 for measurement.
Wait cost priced: −$1,789,200 on one slow step
Experiments reported with the lift, not the vibe
Hottest drop steps queued for salvage
02 Canvas
Read the path the way people leave it
The cart-recover path loses 1,100 people at the entry edge, 2,440 at the first wait and 2,700 before the SMS step. Edge heat is coloured from cool to critical, so the leak is visible before a single report is opened.
18,420 enrolled · 2,442 currently in path
Split engaged: 71% yes, 29% else
Revenue attributed to the path: $412K
03 Steps
The worst steps across every journey
Sorted by drop rate, the table mixes waits, emails and splits from a dozen different paths, because a 37.4% drop hurts the same wherever it lives. Average drop across the filtered view: 13.9%.
Wait 72h: 1,845 dropped of 4,932 entered
Email · incentive: 36.7% drop on win-back
182,596 dropped across the filtered steps
04 Enrollments
Follow one person through the path
The ledger shows who is in, who finished, and why the rest left: 60 active right now, 154 exited or suppressed. A failed row names the step and the reason: channel opt-out at wait short, 59 days in.
60 active · 154 exited or suppressed of 320
Holdout is a first-class status
Search by contact, email or journey
Who runs it
Three roles keep the paths honest.
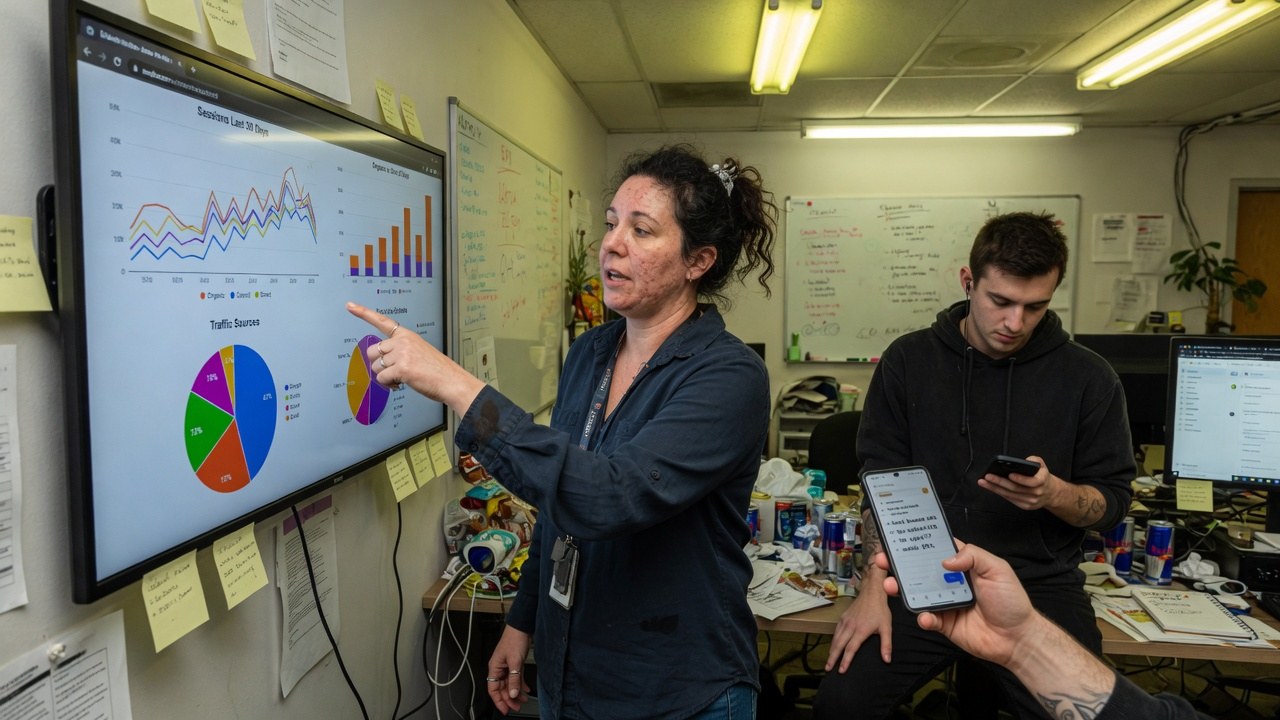
Roles, not references. We have no named customers yet, so nobody in these photographs is quoted, credited or claimed as one.
Lifecycle marketer
Designs the paths on the canvas and reads drop per edge, then moves the email that loses 7,900 people, instead of rewriting the whole journey.
21 live · 26.2% avg drop
Retention lead
Watches conversion and LTV by path, and defends the holdout cohort when someone wants the win-back volume back.
holdout cohort · week 11
Marketing ops
Keeps suppression, opt-outs and exit reasons clean in the ledger, so a suppressed contact stays suppressed everywhere.
154 exited/suppressed of 320
The shape of it
What the demo workspace actually looks like.
Every figure below is legible in the captures above. Nothing here is a projection of your estate. It is the state of the demo data.
213Kpeople enrolled across paths22,868 active right now
23.2%average conversion42,263 converted
328steps across all pathsaverage drop 13.9%
$6.61Mwait-cost opportunitythe price of slow paths
Hottest drop steps across the programdrop % of entered · salvage queue
Wait 72h, Loyalty wave37.4%
Wait 30h, Activation rescue37.3%
Email · incentive, Win-back 90d silent36.7%
Email · we miss you, Win-back 90d silent35.7%
Wait 13h, Churn wave32%
Wait 5 days, Win-back 90d silent31%
Cart-recover path conversion2,300 converted of 18,420 enrolled
12%
Converted · 2,300 people · $412K
In path or dropped · the other 88%
Enrollment ledger outcomes154 of 320 exited or suppressed
Exited or suppressed · 154
Active or completed · 166
How it runs
A journey's life, in the order it actually happens.
01
Enroll
An entry trigger puts a person on the path: cart abandoned, one hour. The ledger opens a row the same moment.
02
Wait
Timed steps hold people between touches, and the wait cost of every slow edge is priced in dollars, not hand-waved.
03
Branch
Splits read engagement (71% yes, 29% else on the cart path) and send each side down a different sequence.
04
Learn
Experiments run inside live paths and holdouts stay frozen for measurement, so the lift claim survives the meeting.
One record
Journeys reads the record the estate already keeps.
Enrollment, suppression and conversion are not journey-private state. The same people, forms and revenue show up in the rest of the estate.
Finding this out on the third call is worse for you than reading it here, and worse for us.
Journeys is not generally available. What opens today is the live build running on demo data.
We have no named customers to show you, so this page shows none. The workspace and the people in the captures are the software's demo data, not references.
The canvas in this build is read-only. The screen itself says so. Editing paths is not something this page demonstrates.
Attributed revenue and wait-cost figures come from the demo's attribution model. They show the mechanics; they are not a promise of your numbers.
The demo ledger shows sends and statuses. Live sending volumes and deliverability are not claimed here.
No audit or compliance certification has been issued for Journeys. What we can evidence about hosting, encryption and access is on the security page.
Yes. Every screenshot is a capture of the running build and you can open the same build at /app/journeys. It runs on demo data: the paths and people are the demo workspace's.
What is wait cost?
The dollar price of slow steps. The Pulse prices a five-day wait on the win-back path at $1.79M in lost opportunity, so a timing argument becomes a budget argument with a number on it.
Can we see why people left a path?
Yes, per person. The enrollment ledger carries an exit reason on every row (suppression list, unsubscribed, channel opt-out, hard bounce, goal met) alongside the step and the days in path.
How do experiments work?
Inside live paths, with holdouts. The Pulse reports the payment-fail SMS experiment at +15.2 points and keeps a control cohort frozen for the quarter's measurement.
Is Journeys audited or certified?
No certification has been issued. What we can evidence about hosting, encryption, tenant isolation and production access is written up on the security page.
The paths are running. Go and look at them.
Live build, demo data, no card. Then ask where your win-back path would leak.