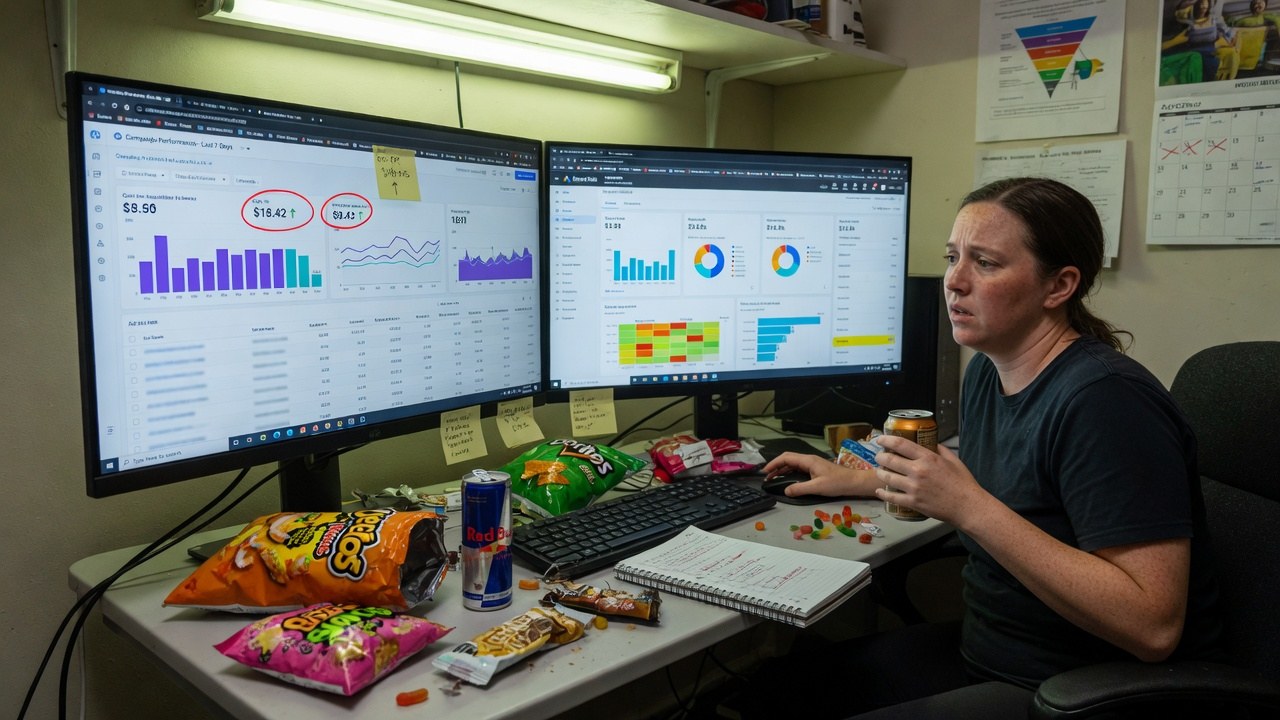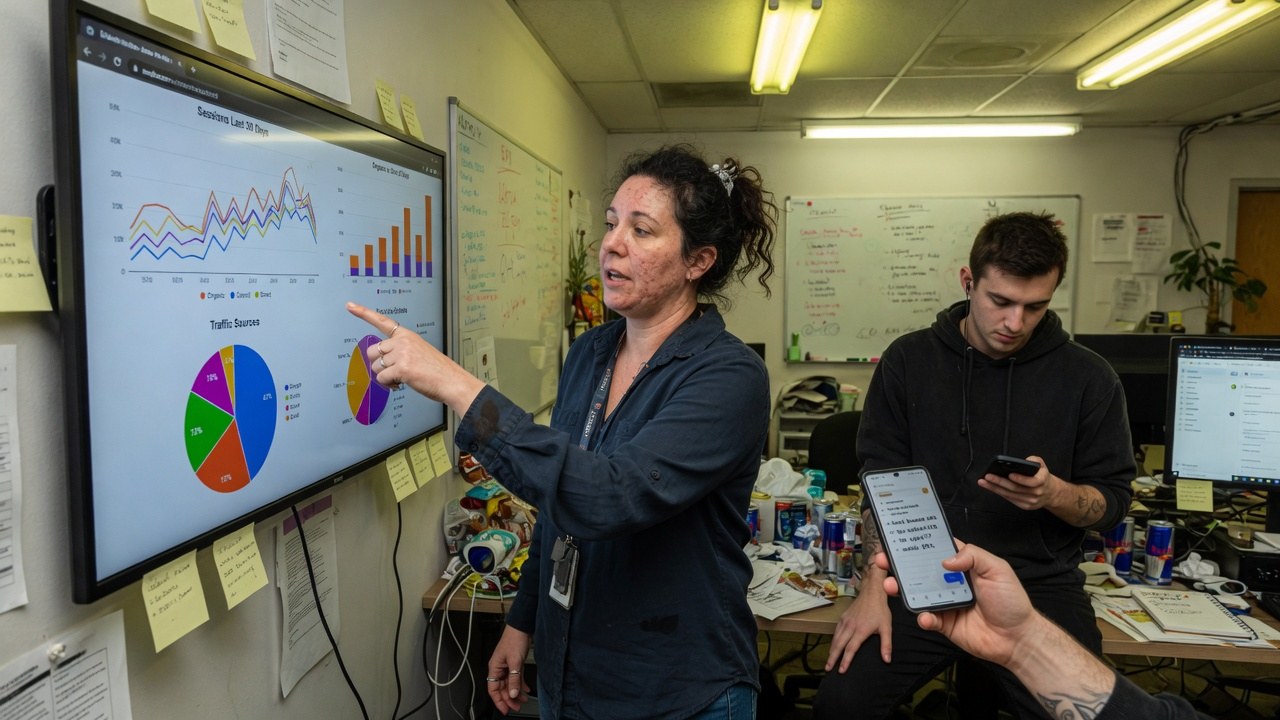
An analyst pointing at traffic charts on a wall-mounted dashboard while a teammate checks the numbers on a phone.

CEDX Web Analytics · Marketing

The chart is the start.
The session is the proof.

Overview cards, a realtime view with 412 people on the site right now, and a session ledger where every row opens — channel, landing page, duration, device, conversion, revenue. And a health score that watches the tracking itself.

Checkout conversion fell 18% last week. The alert already knows why: payment-step errors rose after a 15-minute CDN incident, and it says so.

web-analytics.cedxsystems.com — live build
CEDX Web Analytics overview: 186.4K sessions, 142.1K users, 41.2% bounce, 2.84% conversion, $428K attributed revenue, tracking health 91.

Runs on demo data. The chrome reads stream lag ~2s · demo seed.

186.4K sessions in 30 days142.1K users · 28.4K of them new
412 people on the site now18 events a minute in the live view
2.84% conversion ratepurchase goal · $428K attributed, demo model

What it is

Three things measurement has to get right.

Realtime that is actually real time

412 active users, 18 events a minute, and a 30-minute strip of users per minute. The geo mix reads US 62%, Canada 11%, UK 8%; the top pages right now are the homepage at 184, shell jackets at 96, and checkout at 48 — which means 48 people are deciding this second.

  • Users per minute, last 30 minutes
  • Event mix: page_view, view_item, add_to_cart, purchase
  • Top pages right now, ranked live
web-analytics — screen-3
Realtime that is actually real time

Sessions you can open one by one

The 400-row sample ledger shows started, channel, landing page, pages, duration, device, conversion and revenue. One social session viewed 10 pages in 1 minute 18 seconds and converted at $460. Aggregates are computed from rows like that — rows you can read.

  • Channel chips: organic, paid, direct, referral, social
  • 76 converted of the 400-row sample
  • Revenue on the row, not in a separate report
web-analytics — screen-4
Sessions you can open one by one

Health of the tracking, not just the traffic

Tracking health reads 91 — two missing events, seven slow pages, bot share 3.4%. Because when the tag lies, every downstream number is a negotiation. The alerts carry causes: bounce on the sale page climbed to 54% because the ad promised 30% off and the hero still shows full price.

  • Missing events 2 · slow pages 7 · bots 3.4%
  • Annotations on the chart: redesign, incident, test
  • Page signals: conversion and bounce side by side
web-analytics — overview
Health of the tracking, not just the traffic

Product tour

Three screens, captured from the running build.

Not a mockup and not a concept deck. This is what opens at /app/web-analytics.

web-analytics.cedxsystems.com
CEDX Web Analytics Overview screen.CEDX Web Analytics Realtime screen.CEDX Web Analytics Sessions screen.

01 — Overview

The traffic brief, with causes attached

Sessions by channel: organic 62,400, paid 41,200, direct 31,800, social 18,400, email 14,200. Page signals pair conversion with bounce — checkout converts 38.2% with 12.4% bounce while a campaign landing converts 11.3% with 56.6% bounce. Same chart, opposite health.

  • Channel mix in sessions, 30 days
  • Checkout CR 38.2% · bounce 12.4%
  • Alerts with why, not just what

02 — Realtime

Watch the site breathe

The realtime screen is where a launch gets watched: active users ticking, the per-minute strip bending, three conversions in the last five minutes split between purchase and sign-up events.

  • 412 active · 18 events per minute
  • Conversions in the last 5 minutes: 3
  • Geo mix updating live

03 — Sessions

Open the row behind the number

Filter to converted and the ledger becomes 76 receipts: a referral session that browsed base layers and spent $179, an email session that went straight to a product page and took 6 minutes 44 seconds to decide.

  • 400-session sample, sized on screen
  • Duration and device per row
  • Converted filter for the receipts

Who runs it

Three roles keep the numbers honest.

Roles, not references. We have no named customers yet, so nobody in these photographs is quoted, credited or claimed as one.

Analyst

Reads the overview and the page signals, and walks into the meeting with the cause, not just the delta.

sessions · 186.4K

Performance marketer

Watches paid sessions against conversion rate, and catches the landing page whose promise does not match the ad.

paid · 41,200 sessions

Marketing ops

Owns tracking health — the two missing events and the seven slow pages are a work queue, not trivia.

health 91 · 2 missing events

The shape of it

What the demo site actually looks like.

Every figure below is legible in the captures above. Nothing here is a projection of your estate — it is the state of the demo data.

186.4Ksessions in 30 days142.1K users · 28.4K new
41.2%bounce ratedown 1.8pp vs prior
3m 12saverage engaged durationup 14s
91tracking health2 missing events · 3.4% bot share
Sessions by channel, 30 days186.4K sessions · channel mix
  • Organic62,400
  • Paid41,200
  • Direct31,800
  • Social18,400
  • Other18,400
  • Email14,200
Tracking healthtag + quality, inputs on screen
91
  • Health 91 — up 4 vs prior week
  • Missing events 2 · slow pages 7
Converted in the sample76 of 400 sampled sessions
  • Converted · 76
  • Browsed · 324

How it runs

A visit's life, in the order it actually happens.

01

Tag

The tracking itself is scored — missing events, slow pages, bot share — before any traffic number is trusted.

02

Observe

Overview trends the month; realtime watches the minute. Both read the same stream.

03

Explain

Alerts arrive with causes — the CDN incident, the mismatched sale hero — not bare deltas.

04

Attribute

Revenue is attributed per channel in the demo model, labelled as a model on the card itself.

One record

Analytics reads the record
the estate already keeps.

The sessions being measured are the ones the rest of the estate creates — same channels, same pages, same campaigns.

All 132 applications

Limits

What Web Analytics does not do yet.

Finding this out on the third call is worse for you than reading it here, and worse for us.

Start

Open it before you talk to anyone.

Pilot

Your site, your events

  • Everything in Try
  • Tracking-health audit
  • Attribution-model workshop
  • Estate map
Talk to sales

Estate

Analytics with the rest of it

  • Web Analytics with Pages, Campaigns and SEO
  • One identity, one bill
  • CEDX delivery
Book an estate map

Questions

Before you pilot Web Analytics.

Is the software on this page real?

Yes. Every screenshot is a capture of the running build and you can open the same build at /app/web-analytics. The chrome reads stream lag ~2s · demo seed.

What is tracking health?

A score on the measurement itself — two missing events, seven slow pages, 3.4% bot share on the demo. When the tag degrades, the score drops before your reports quietly rot.

Can we really open individual sessions?

Yes. The ledger sample shows each session's channel, landing page, page count, duration, device, conversion and revenue — 400 rows in the demo, with a converted filter that returns 76.

Where does the revenue figure come from?

From the attribution model — and the card says demo model on itself. It demonstrates how attributed revenue reads per channel; it is not a claim about your numbers.

Is Web Analytics audited or certified?

No certification has been issued. What we can evidence about hosting, encryption, tenant isolation and production access is written up on the security page.

The stream is running. Go and look at it.

Live build, demo data, no card. Then ask what your tracking-health score would read.