Most project tools tell you what slipped last week. Projects watches the active sprint and says what is about to slip: 32 issues blocked across the demo workspace, a carry-over forecast of 22 pts at close, and the exact issue driving it.
The slip predictor on the Overview does the arithmetic in the open: “If DATA-904 stays blocked, carry forecast rises from 14 → 24 pts (+71%).” You can argue with a forecast that shows its working.
projects.cedxsystems.com: live build
Runs on demo data. The workspace and issue keys in the captures are the seeded demo set.
340 issues on the board48 backlog · 60 todo · 59 in progress · 52 in review · 32 blocked · 89 done
22 pts forecast to carrycarry-over prediction on the active sprint, priced per issue
86% carry risk on INV-1123the highest-risk row, blocked with 7 pts remaining
What it is
Three things a delivery tool owes you.
A roadmap that admits what is blocked
Twelve epics on a Q2 to Q4 2026 timeline, bar = target window, each with status, priority, progress, points and issue count. Seven are in progress, one is blocked; the blocked one, the analytics warehouse cutover, renders in red instead of hiding in an average.
The Sprints screen puts the arithmetic on one line: capacity 48 pts, committed 52 pts, completed 19, scope added 6 mid-sprint. Sprint 42 is over-committed by 4 pts and the product says so in orange, not in a post-mortem.
Velocity mean 40 pts ±2.2 over the tracked sprints
Cap, commit, done and carry-in per sprint, exportable
Goal on screen: “Ship checkout v3 beta + auth MFA”
projects screen-2
A slip predictor that shows its working
Scope creep gets a number, not a vibe: 6 pts added mid-sprint in week 32, the fourth consecutive sprint with adds, with a guardrail suggestion, cap scope-adds at 4 pts or require a swap. Each alert arrives root-caused: symptom, cause, fix.
Not a mockup and not a concept deck. This is what opens at /app/projects.
projects.cedxsystems.com
01 Overview
The state of the work, with the risks priced
251 open issues, 111 in progress, velocity 40 pts over six sprints, 32 blocked and a carry-over forecast of 22 pts. Each card sparklines its own trend. Below, the root-caused alerts name the issue and the points at stake: INV-1123 carry risk 86%, Sprint 42 over-committed +6 pts.
Throughput vs commitment, weekly, W1 to W12
Sprint health 20%: progress 8%, carry forecast 22 pts
32 issues blocked, above the 4-week median
02 Sprints
Capacity first, commitment second
Twelve sprints tracked, history and future in one table. The active sprint carries 52 pts against 48 pts of capacity with 6 pts of scope added mid-flight. The progress bar reads 37% and the projected carry is 22 pts at the 95th-risk marker.
Velocity mean 40 pts ±2.2 across the tracked cycles
Future sprints 43 and 44 already carry 48 pts of cap
03 Triage
An intake queue, not a dumping ground
Nine items await a decision; the queue suggests routing from component ownership before anything hits the backlog. Each row offers Accept, Route → component, or Defer, with the confidence printed: 91% on the checkout route, 61% on mobile, and duplicates flagged at title similarity ≥ 75%.
The timeline is a target window, not a promise: Q2 to Q4 2026, twelve epics, seven in active delivery, one blocked. Under the bars, the same epics as a ledger (status, priority, progress, points, issues, owner, target end), with CSV export of the view you are looking at.
Progress per epic from 10% to 43% in view
Mobile offline mode: 25%, the widest bar on the board
Filter chips P0 to P3 and saved views on the ledger
Who runs it
Three roles keep a board honest.
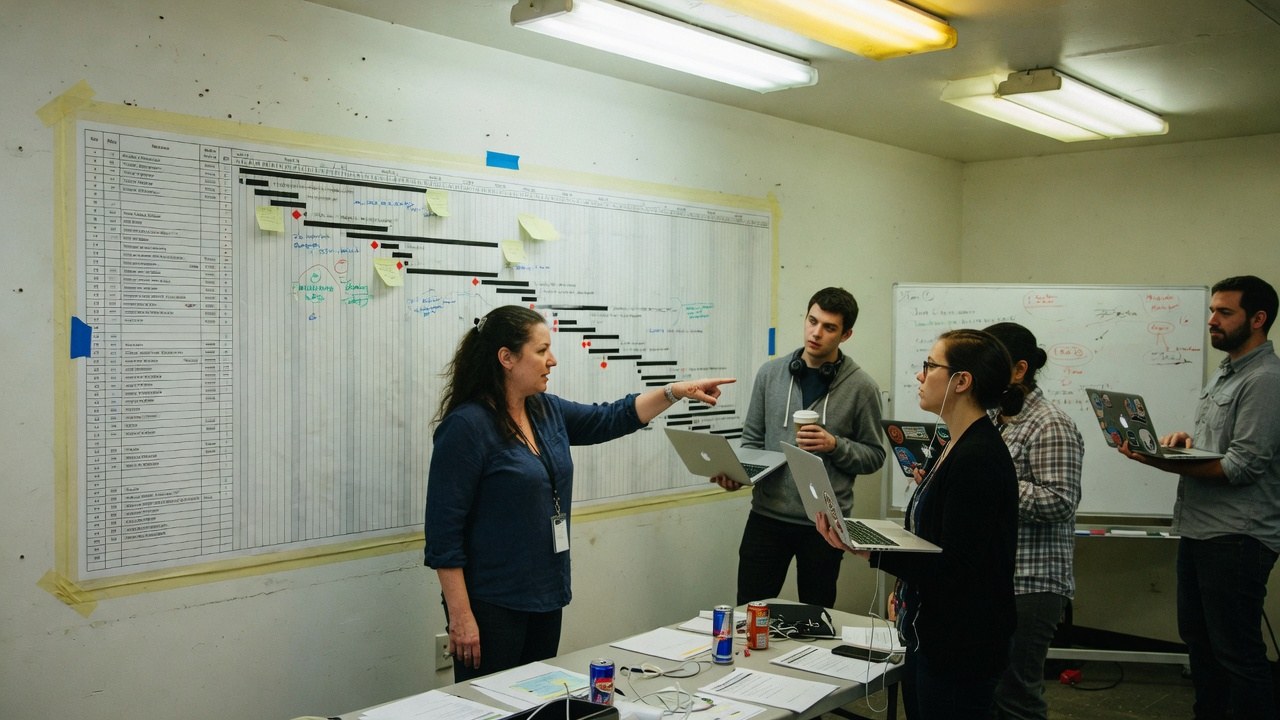
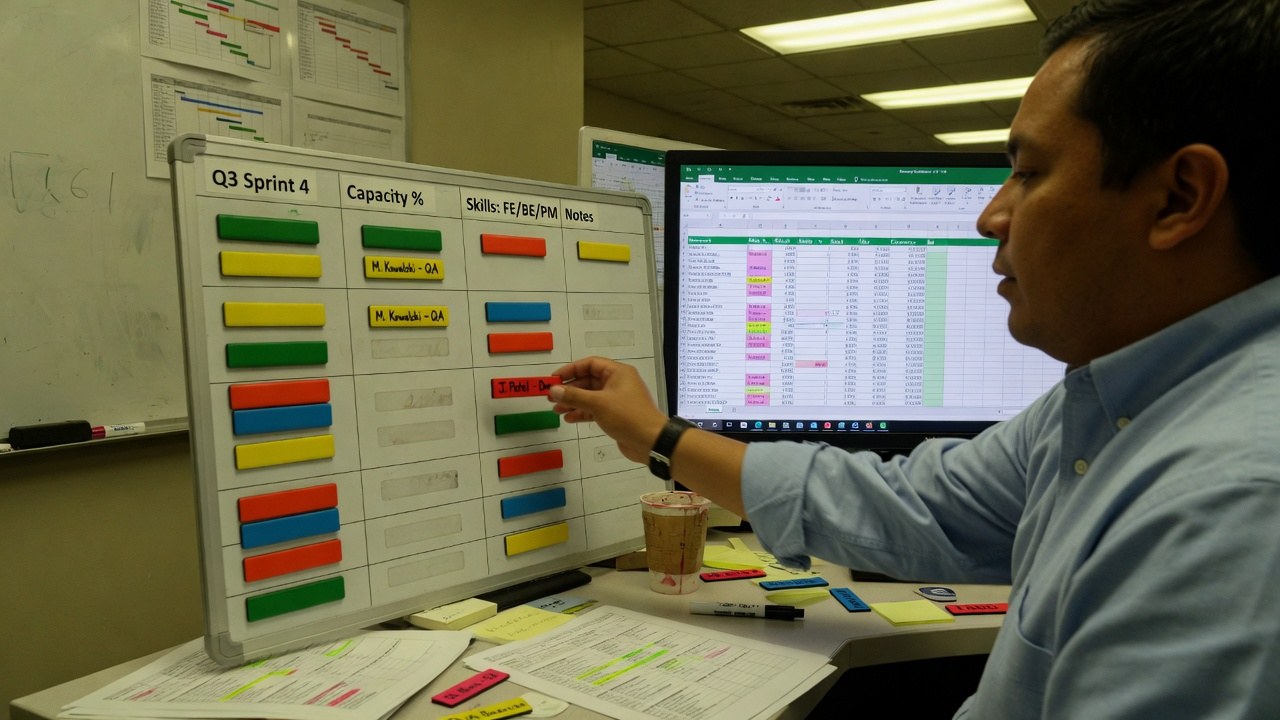
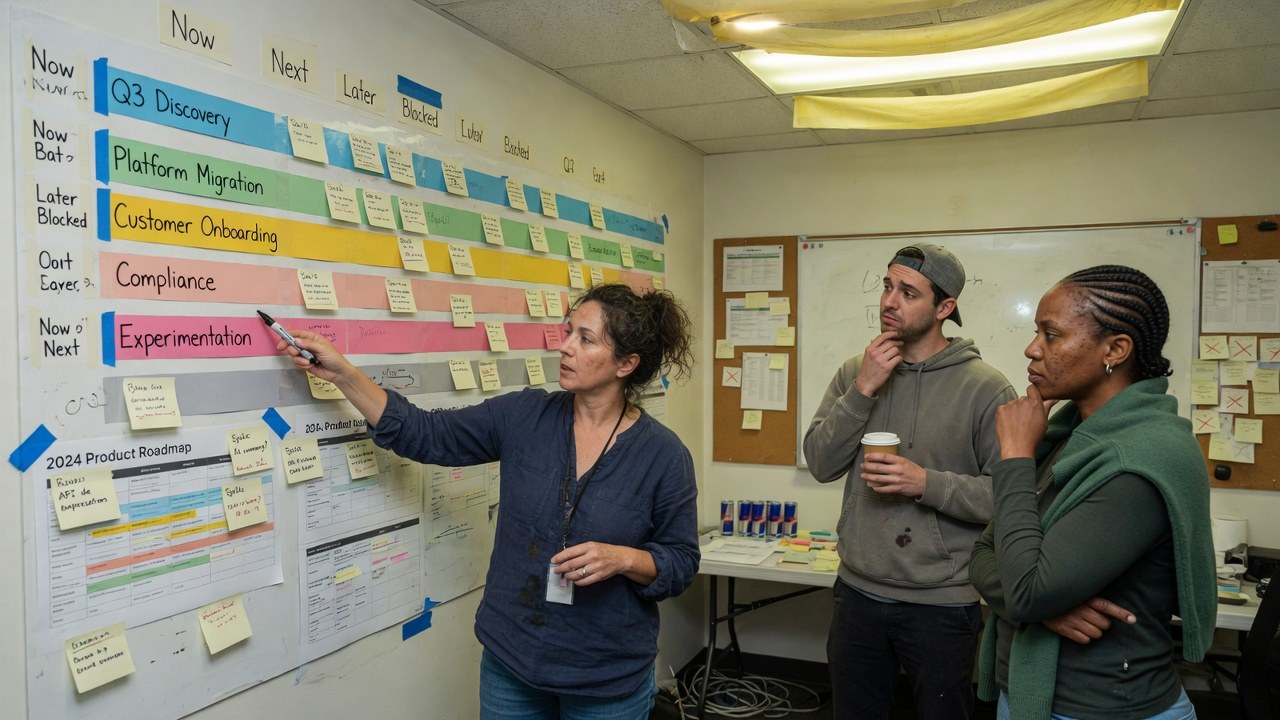
Roles, not references. We have no named customers yet, so nobody in these photographs is quoted, credited or claimed as one.
Scrum master
Runs Sprint 42 off the Sprints screen: 52 committed against 48 of capacity, scope adds argued one at a time, carry forecast on the wall at stand-up.
velocity · 40 pts ±2.2
Resource planner
Watches the blocked column and the people behind it: 32 blocked issues is a staffing fact as much as a process one.
blocked · 32
Product manager
Owns the twelve epics and says the blocked one out loud. Progress on the timeline is a target window, and the ledger underneath backs it with points and issue counts.
epics · 12 on roadmap
The shape of it
What the demo workspace actually looks like.
Every figure below is legible in the captures above. Nothing here is a projection of your estate. It is the state of the demo data.
340issues on the board89 done · 32 blocked
40 ptsvelocity, 6-sprint mean±2.2 across the tracked sprints
52 ptscommitted on Sprint 42against 48 pts capacity, over by 4
DATA-904 · Warehouse cutover blocked on legacy CDC lag74%
CHK-1253 · Ship billing hook68%
CORE-1141 · Remove webhook handler64%
Sprint 42 completion19 done of 52 committed
Done · 19 pts so far
Open · 33 pts, carry forecast 22 at close
Sprint health, as the ring prints itprogress 8% · high slip 7 issues
20%
Health 20%: done/committed 0/640 pts on the quarter view
Carry forecast 22 pts · 7 issues at high slip
How it runs
A piece of work's life, in the order it happens.
01
Triage
Work lands in the intake queue with a suggested route from component ownership and a confidence score. Accept, route, or defer. Nothing enters the backlog silently.
02
Commit
The sprint is planned against capacity, not hope: 52 pts committed on 48 pts of capacity is visible the moment it happens, with the over-commit in orange.
03
Deliver
The board moves 340 issues through backlog, todo, in progress, review and done, while the slip predictor re-prices carry-over on every change.
04
Review
Velocity, throughput and the blocked median close the loop. The roadmap's red bar is the conversation the next planning session starts with.
One record
The board is one face of the same record.
Projects does not keep a parallel copy of the work. The sprint, the issue and the roadmap entry are the same row read at different altitudes.
Finding this out on the third call is worse for you than reading it here, and worse for us.
Projects is not generally available. What opens today is the live build running on demo data. The workspace and every issue key in the captures is the seeded demo set, not a customer's board.
We have no named customers to show you, so this page shows none. The people named on screen (assignees, the triage rotation) are demo personas, not references.
The slip predictor and carry forecast are statistical readings of the demo data. They are not a promise that your dates will hold, and we do not market them as one.
There is no built-in time tracking on the board. Hours against this work live in Timesheets; Projects shows points, not time.
No audit or compliance certification has been issued for Projects. What we can evidence about hosting, encryption and access is on the security page.
Yes. Every screenshot is a capture of the running build and you can open the same build at /app/projects. It runs on demo data, which the captures themselves make legible.
How does the carry-over forecast work?
Issue by issue, in the open. The slip predictor scores each committed issue (INV-1123 reads 86% because it is blocked with 7 pts remaining) and sums the expected remainder into the 22 pts carry forecast. The “If DATA-904 stays blocked” card shows the counterfactual arithmetic on the screen.
What stops mid-sprint scope creep?
Visibility first: the Sprints screen prints scope added (6 pts in week 32) next to capacity and commitment. The Overview goes further and suggests the guardrail: cap scope-adds at 4 pts or require a swap, after four consecutive sprints with adds.
How does triage decide where things go?
From component ownership. Each intake row arrives with a suggested component and owner and a confidence score (91% on the top row), and a human on duty accepts, re-routes or defers. Duplicates are flagged at title similarity ≥ 75% before they reach the backlog.
Does Projects replace our issue tracker?
It is not a separate tracker. The issues on the board are CEDX Issues records with labels, workflows and SLA clocks; Projects is the plan and delivery view over the same rows.
Is Projects audited or certified?
No certification has been issued. What we can evidence about hosting, encryption, tenant isolation and production access is written up on the security page.
The board is running. Go and look at it.
Live build, demo data, no card. Then check what your current sprint would score on the commit-risk table.