Issues tracks the work from intake to done with the clocks on: SLA attainment 88%, 25 breached clocks named row by row, cycle outliers flagged at z=4.44, and a triage queue with a named human on duty.
The labels catalog has a policy, not just tags: p0-watch is “Leadership-watched P0 stream” with 40 open; unused labels read “candidates to archive.” There are zero. Somebody prunes.
issues.cedxsystems.com, live build
Runs on demo data. The SLA table still prints raw floats on some rows (see Limits); we would rather show it than crop it.
206 open of 32057 open · 66 in progress · 65 in review · 18 blocked · 114 done
88% SLA attainment25 open clocks already breached, listed by row
79 bugs + incidentsopen defects across the demo workspace
What it is
Three things an issue tracker should admit.
Triage is a decision, with a name on it
Nine items wait in the intake queue; a named person is on duty: Ravi, week 32, incident-first rotation. Each row arrives with a suggested component, owner and confidence, and duplicates are flagged at title similarity ≥ 30% before they enter the queue.
Route → component, Accept or Defer on every row
Confidence printed: 94% down to 61% in view
Duplicate suggestion: “dup? CORE-1882 · 36%”
issues screen-2
Workflows with named transitions
Four workflows (Standard delivery, Bug lifecycle, Incident path, Support SLA) with states and named transitions, not a free-for-all: Start, Submit review, Block, Unblock, Accept, Request changes, Quick close. 198 issues ride the default; the Support SLA workflow sits at zero and shows it.
5 states, 7 transitions on Standard delivery
Issue counts per workflow: 198 · 58 · 64 · 0
Transitions named after the action, not the state
issues screen-4
The clocks are on the record
SLA attainment reads 88% with the 25 breached clocks listed individually: issue key and hours over. Cycle outliers get a z-score: CHK-2401 at z=4.44, eight days against a two-day baseline, P0 bug, in progress.
Dep risk 98 on CHK-2401: blocks 1, depth 5
148 nodes at high dependency risk in the graph
Opened vs resolved, weekly, with freezes annotated
issues overview
Product tour
Four screens, captured from the running build.
Not a mockup and not a concept deck. This is what opens at /app/issues.
issues.cedxsystems.com
01 Overview
The queue, with its health score
Queue health reads 78% and shows the components: SLA attainment 88%, 25 breached clocks, 148 nodes at high dependency risk, 169 cycle outliers. The alerts are root-caused (symptom, cause, fix) and the worst row is named twice: CHK-2401, dep risk 98 and a cycle outlier at z=4.44.
Opened vs resolved, weekly W1-W12
18 blocked across the workspace, above the 4-week median
Two P0s in review flagged “protect review SLA”
02 Triage
Nine items, one human on duty
The intake queue suggests routing from component ownership (checkout, core platform, inventory, data plane, mobile app) and prints its confidence. The person on duty accepts, re-routes or defers; nothing auto-commits to the backlog.
In queue 9 · accepted 0 · duplicates flagged 2
Similarity threshold for duplicates: ≥30% on title
Rotation labelled: week 32 · incident-first
03 Labels
A catalog, not a pile of tags
Twenty-four labels, each with a description: p0-watch is the leadership-watched stream, blocked means external or internal wait, compliance covers audit, retention and policy. Open and total counts sit on every row, and the unused-label count is zero.
p0-watch: 40 open of 56 tagged
blocked: 34 open, matches the board's blocked column
“Candidates to archive: 0”, the catalog is pruned
04 Workflows
States and transitions you can read
Standard delivery runs Story, Task and Spike through Open, In Progress, In Review, Blocked and Done: 32, 42, 40, 13 and 71 issues respectively. The transitions are named for the human action: Block, Unblock, Request changes, Quick close.
127 open on the default workflow, 198 total
Bug lifecycle: 58 issues · 37 open
Incident path: 4 states, 64 issues, 42 open
Who runs it
Three roles keep the queue moving.
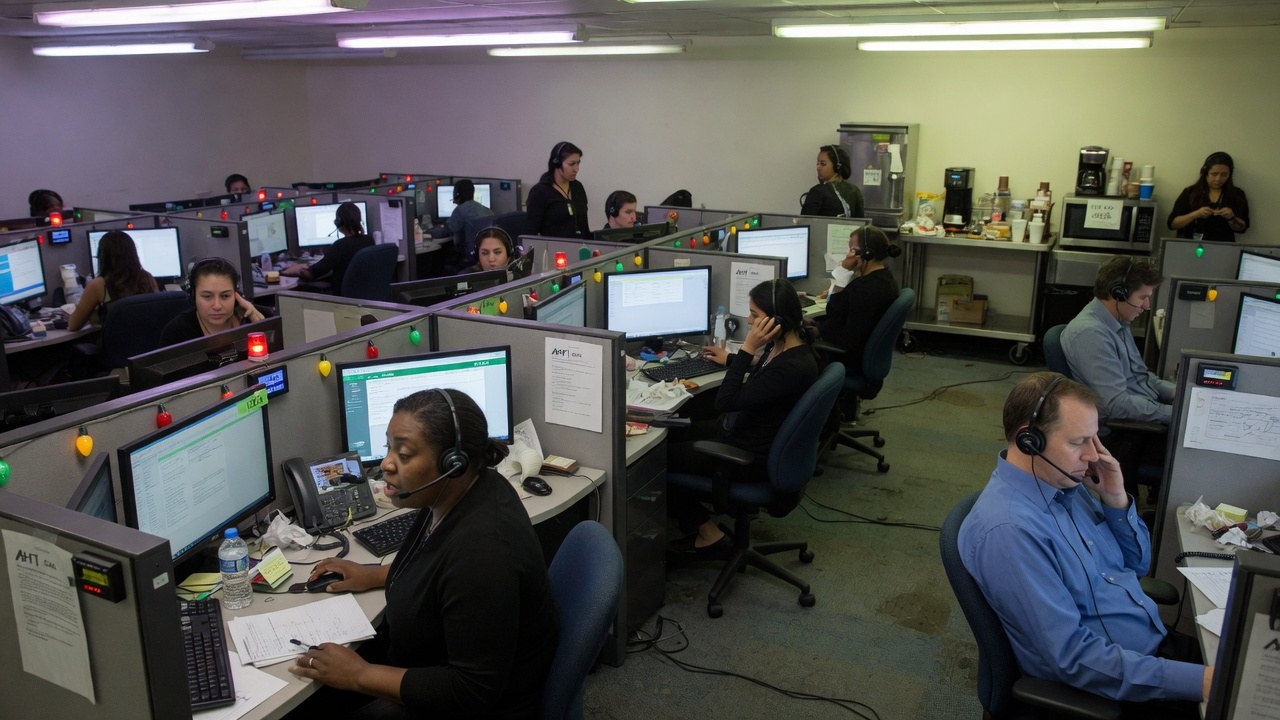
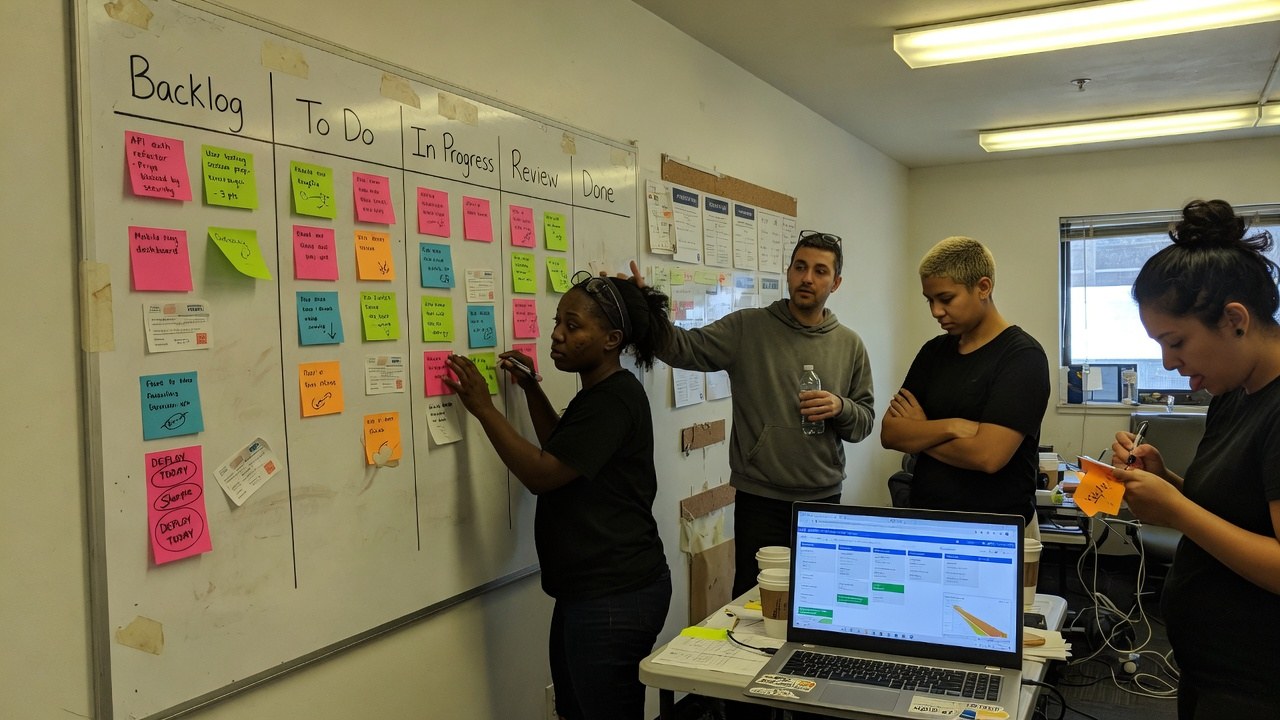
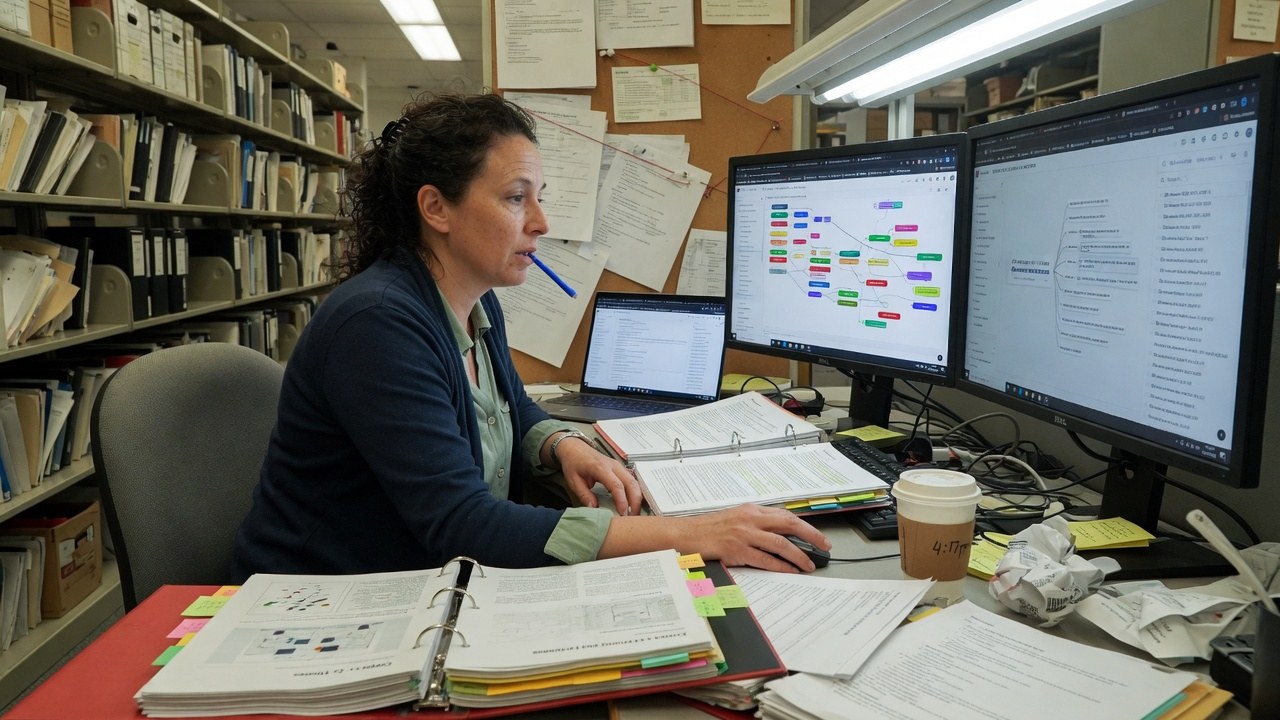
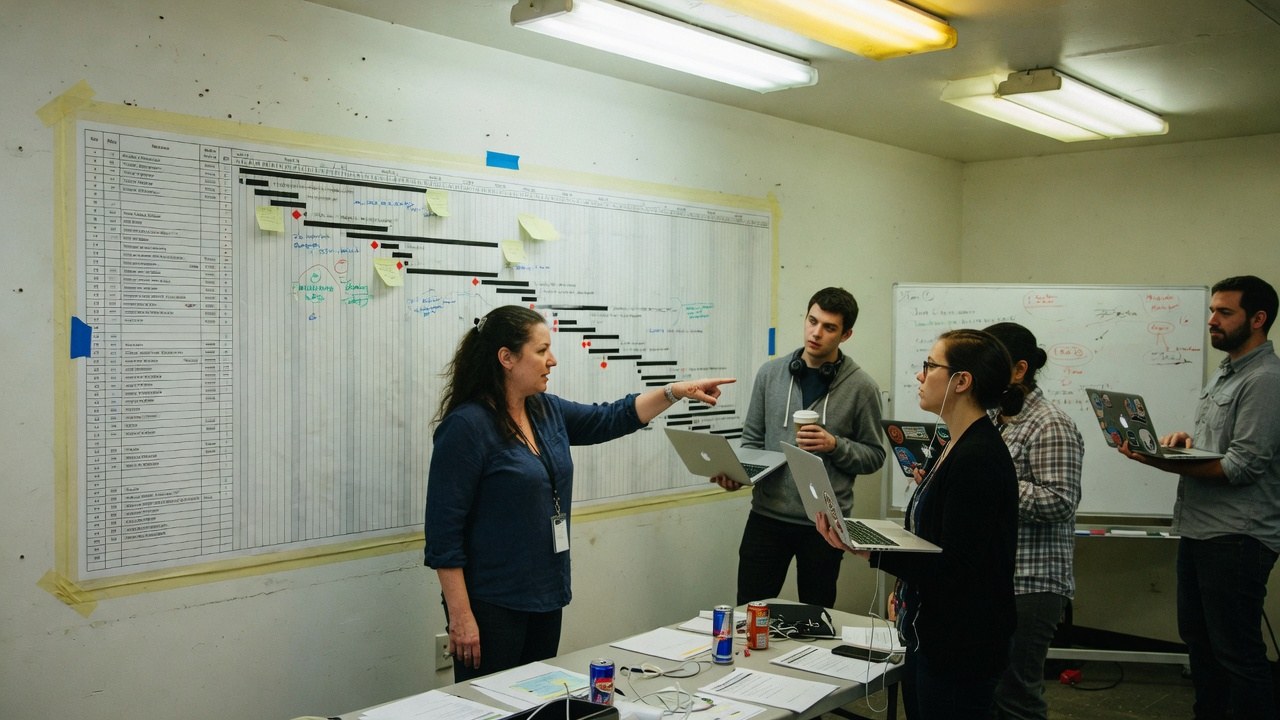
Roles, not references. We have no named customers yet, so nobody in these photographs is quoted, credited or claimed as one.
Triage on duty
Works the intake queue on rotation: nine rows, each with a suggested route and a confidence, and a decision to accept, route or defer before the backlog sees it.
in queue · 9
Quality and docs
Owns the labels catalog and the workflows: 24 labels with descriptions, zero unused, and transitions named so a new engineer reads them without a walkthrough.
labels · 24 catalogued
Engineering lead
Watches the clocks: 25 breached SLA rows and the z=4.44 outlier are the stand-up agenda, not a monthly report.
SLA attainment · 88%
The shape of it
What the demo queue actually looks like.
Every figure below is legible in the captures above. Nothing here is a projection of your estate. It is the state of the demo data.
320issues in the workspace206 open · 114 done
25SLA clocks breachedof the open clocks, listed row by row
z=4.44worst cycle outlier8d against a 2d baseline · P0 bug
98top dependency riskblocks 1 · depth 5 · in progress
SLA clocks at riskhours past goal · as the table prints them
DATA-1883 · Optimize metrics panel−20.2h
CORE-1226 · Migrate null check, the row that prints the raw float−19.5h
DATA-1838 · Migrate rollup job−19.0h
DATA-904 · Warehouse cutover blocked on legacy CDC lag−18.0h
INV-1231 · Stabilize rate limiter−17.1h
Issues by status114 done of 320 in the workspace
Done · 114
Open · 206: 57 open, 66 in progress, 65 in review, 18 blocked
A report lands in the triage queue with a suggested component, owner and confidence. A named human on duty accepts, routes or defers. Duplicates are flagged first.
02
Label
The issue joins the catalog properly tagged: p0-watch, blocked, compliance. There are 24 labels with descriptions, so the tag means the same thing to everyone.
03
Work
It moves through a named workflow (Open → In Progress → In Review → Done) with Block and Unblock as first-class transitions, not comments.
04
Clock
SLA attainment, cycle time and dependency risk are scored continuously. A breach is a row in a table with hours over, not a surprise in a quarterly review.
One record
One issue, read at every altitude.
The same key appears on the triage queue, the sprint risk table and the delivery board. There is no export to keep in sync. The estate reads one record.
Finding this out on the third call is worse for you than reading it here, and worse for us.
Issues is not generally available. What opens today is the live build on demo data. Every key, label and clock in the captures is seeded.
We have no named customers to show you, so this page shows none. The people on the triage rotation and the suggested owners are demo personas.
The SLA-clocks table on the demo build prints raw floats on some rows: “−19.512999999999998h” is legible in the capture. The math is right; the formatting is not finished. We left the capture honest rather than crop it.
Duplicate detection is title similarity, printed with its percentage. It is a suggestion for the human on duty, not an automatic merge.
No audit or compliance certification has been issued for Issues. What we can evidence about hosting, encryption and access is on the security page.
Yes. Every screenshot is a capture of the running build and you can open the same build at /app/issues. It runs on demo data.
How does triage routing work?
From component ownership. Each intake row suggests a component and owner with a confidence score (94% on the top row, 61% near the bottom), and the person on duty decides. Duplicates are flagged by title similarity, with the percentage shown.
What is a cycle outlier?
An issue whose cycle time is far off its baseline, scored as a z-value. CHK-2401 reads z=4.44 (eight days against a two-day baseline for a P0 bug), and the alert names the issue, the score and the baseline.
What does dependency risk measure?
Where an issue sits in the blocking graph. CHK-2401 scores 98 because it blocks one issue at depth 5 while in progress; 148 nodes in the workspace sit at high risk by the same measure.
Can workflows differ per issue type?
Yes. The demo workspace runs four: Standard delivery (Story, Task, Spike), Bug lifecycle, Incident path and Support SLA. Each has its own states and named transitions, and the issue counts per workflow are on the screen.
Is Issues audited or certified?
No certification has been issued. What we can evidence about hosting, encryption, tenant isolation and production access is written up on the security page.
The queue is running. Go and look at it.
Live build, demo data, no card. Then check what your oldest open issue would score on the outlier table.