Sprints turns planning into arithmetic: 52 pts committed against 48 pts of capacity, 0 pts of headroom, and a commit-risk model that scores all 18 issues in the sprint and expects 21 pts to fail, with the reason printed on each row.
The best row in the risk queue is the boring one: risk 5%, top signal “Healthy commit, protect capacity.” A planning tool should tell you when to leave well alone, too.
sprints.cedxsystems.com: live build
Runs on demo data. Sprint 42, day 6 of 14, is the seeded demo sprint.
52 pts committed on 48 capacitySprint 42 over-committed by 4, marked on screen
21 pts expected to failΣ remaining × risk% across the 18 scored issues
26 pts forecast to carryat close: remaining 46, burn 3.21/day, 15 days left
What it is
Three things sprint planning usually papers over.
Capacity is a number, not a feeling
The Commit screen builds capacity from the team up: ten working days, days off subtracted per person. Eli is 3 days off and carries 11 pts against 6: 183%, flagged OVER in red before the sprint starts, not after it burns.
Per-person load vs adjusted capacity, OVER / UNDER printed
Copy from last sprint, one click
sprints screen-2
Risk with a named reason
Every scored issue carries its top signal. DATA-904 sits at 95% with “Unfinished carry-in from prior sprint”; another row reads “Owner historical miss rate 28%”; a third, “Added after sprint start (no capacity trade).” You argue with a reason, not a colour.
18 issues scored · 3 high risk (≥55%)
Expected fail 21 pts = Σ remaining × risk%
Planning simulator and scoring model on their own tabs
sprints screen-3
Carry treated as a forecast, not a surprise
Cycles keeps fourteen sprints of history and future in one ledger: cap, commit, done and carry-out per row. The active sprint's projected carry reads 19 pts at 40% risk on day 6, while the goal line admits 0 of 5 goal issues done.
Velocity mean 40 pts ±2.2 across 14 cycles
Carry-in 8 pts · scope added 6 pts, both on screen
Sprint dates on the record: 2026-07-28 → 2026-08-10
sprints screen-4
Product tour
Four screens, captured from the running build.
Not a mockup and not a concept deck. This is what opens at /app/sprints.
sprints.cedxsystems.com
01 Overview
Day 6 of 14, stated plainly
Committed 52, completed 19, remaining 46, velocity 40. The health ring reads 54% and earns it: goal 0/5 done, blocked open 16, WIP 110. The alerts name the pressure points: DATA-904 at 95% commit risk, the sprint over-committed by 4, and 5 retro actions still open from last time.
Completed vs committed, last 7 sprints, on one chart
Active sprint by status: 5 todo · 6 in progress · 5 in review · 2 blocked · 0 done
Retro actions counted into the sprint they were promised to
02 Commit
Plan the sprint against the people
60 backlog items above the line, 23 of them P0/P1 and marked “should plan soon.” Below, the team's adjusted capacity row by row (role, points per sprint, days off, assigned vs remaining), with two people already OVER before day one.
Backlog items 60 · 238 pts in view
Days off reduce effective points over 10 working days
Capacity bar pinned at 100%: 52 committed, 0 headroom
03 Commit risk
The queue you argue with
Eighteen rows, each with status, points, remaining, risk%, expected fail and the top signal that produced the score. Capacity headroom reads −34 pts; the simulated fail column holds at 21 pts with no levers pulled. The Planning simulator tab is where you pull them.
Filter chips: ≥40%, ≥55%, ≥70% risk
Signals include backlog age 63d without start
Low-risk rows say so: “Healthy commit, protect capacity”
04 Cycles
Fourteen sprints of institutional memory
History and future in one table: cap, commit, done and carry-out per cycle, with the active row's goal (“Ship checkout v3 beta + auth MFA”) and its progress, 13 of 28 goal points done. Carry-out is a column, so a sprint that leaks is visible in the record.
Cycles tracked 14, history + future
Sprint 39: committed 50, done 43, carry 7
Velocity mean 40 pts ±2.2, computed from the table
Who runs it
Three roles carry a sprint.
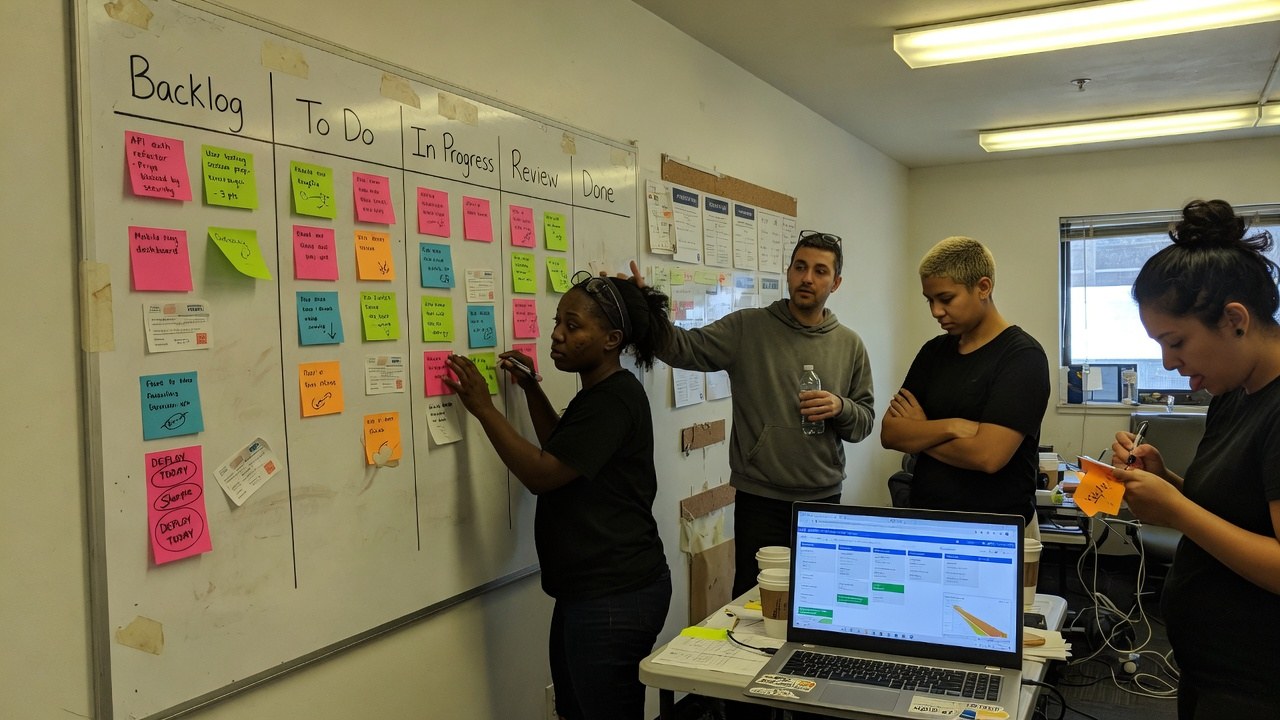
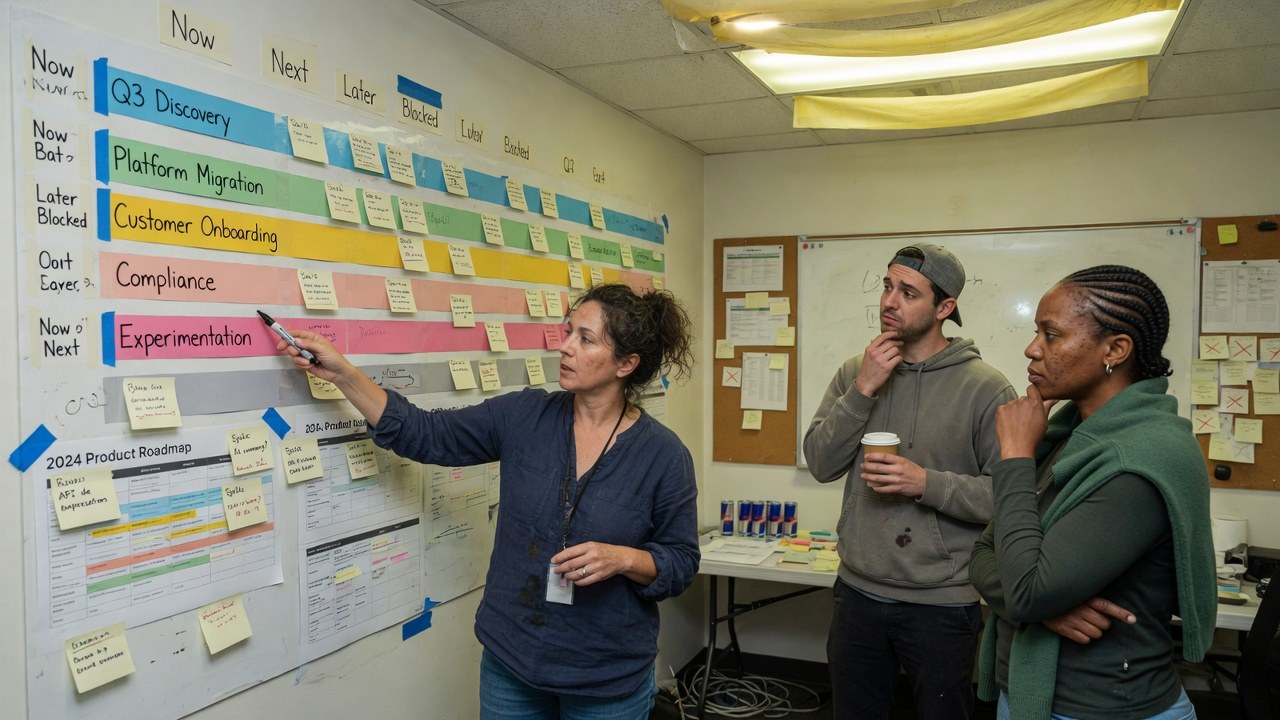
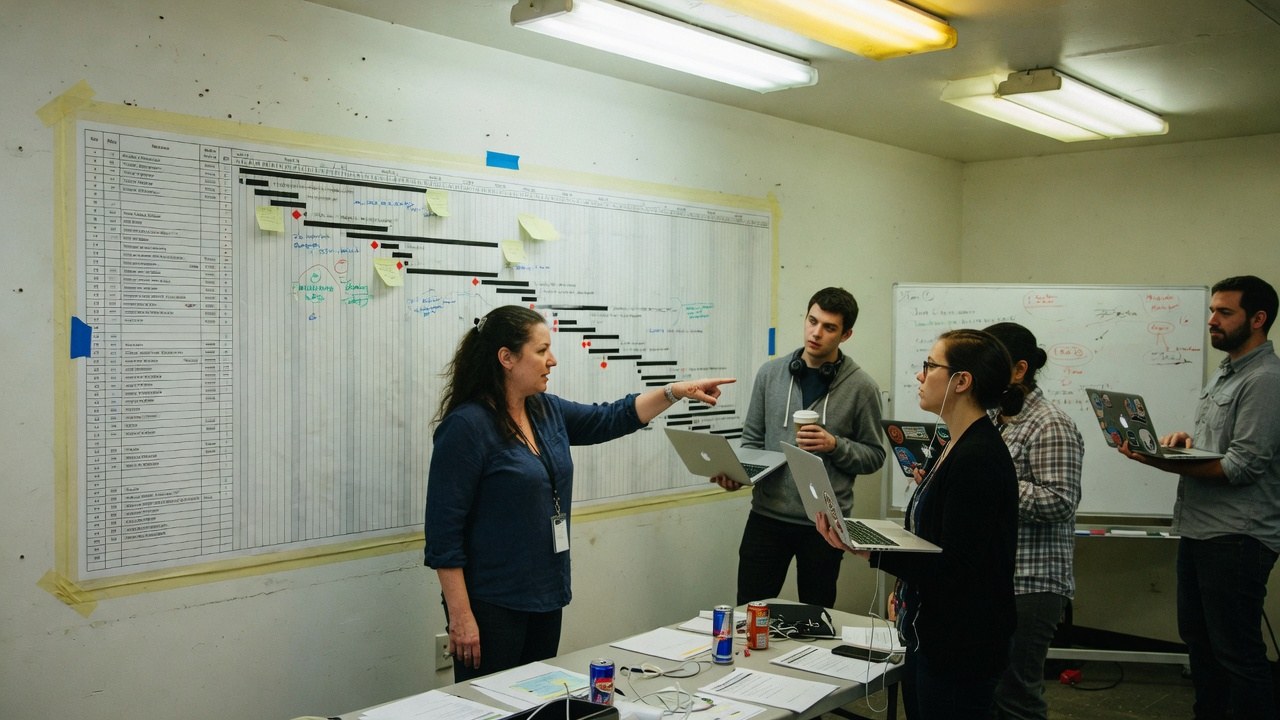
Roles, not references. We have no named customers yet, so nobody in these photographs is quoted, credited or claimed as one.
Scrum master
Lives in the commit-risk queue during planning and the health ring during the sprint. Over-commit by 4 pts is a conversation on day one, not day fourteen.
sprint health · 54%
Product owner
Owns the goal line (0/5 goal issues done on day 6 is their number) and trades scope adds against capacity, one swap at a time.
goal progress · 13/28 pts
Engineering lead
Reads the top signals. “Owner historical miss rate 28%” is a coaching conversation; “unfinished carry-in” is a scoping one. The queue tells them which.
expected fail · 21 pts
The shape of it
What the demo sprint actually looks like.
Every figure below is legible in the captures above. Nothing here is a projection of your estate. It is the state of the demo data.
18issues scored in Sprint 423 rated high risk (≥55%)
21 ptsexpected to failΣ remaining × risk%
−34 ptscapacity headroom82 pts of queue on 48 pts of capacity
40 ptsvelocity mean±2.2 across 14 tracked cycles
Expected fail points, by issueremaining points × risk% · top of the risk queue
DATA-904 · Warehouse cutover blocked on legacy CDC lag: 13 pts at 95%10
CHK-2410 · Tax line item rounding edge cases: 5 pts at 95%4
MOB-611 · Offline queue conflict resolution: 8 pts at 56%4
INV-1211 · Barcode scanner debounce: added after sprint start1
Sprint 42 completion19 done of 52 committed · day 6 of 14
Done · 19 pts
Open · 33 pts: carry forecast 26 at close
Sprint healthgoal 0/5 · blocked open 16 · WIP 110
54%
Health 54% on day 6
5 retro actions from last sprint still open
How it runs
A sprint, in the order it actually happens.
01
Commit
Capacity is built from the team (days off subtracted, per person) and the commitment is checked against it: 52 on 48, with the over-commit flagged before the sprint starts.
02
Score
Every issue in the sprint gets a risk score and a named top signal, so the planning argument is about reasons: carry-in, miss rate, backlog age, estimate confidence.
03
Burn
Day by day the overview reconciles done against committed (19 of 52 on day 6) and re-prices the carry forecast as blocked work sits.
04
Retro
The retro's action items go on the record and into the next sprint's alerts: 5 are still open, and Sprint 42's overview says so.
One record
The sprint is a view, not a silo.
Commitment, risk and carry are computed over the same issues the rest of the estate reads. There is no second copy of the work to reconcile at the end of the sprint.
Finding this out on the third call is worse for you than reading it here, and worse for us.
Sprints is not generally available. What opens today is the live build on demo data. Sprint 42, its people and its points are the seeded demo set.
We have no named customers to show you, so this page shows none. The team named on the capacity rows are demo personas.
The commit-risk score is a heuristic over status, carry-in, history and estimates. It sorts the planning conversation; it does not predict your release date, and we do not sell it as one.
The planning simulator's levers are visible on their own tab in the demo build; what they will and will not model at general availability is not something we are claiming here.
No audit or compliance certification has been issued for Sprints. What we can evidence about hosting, encryption and access is on the security page.
Yes. Every screenshot is a capture of the running build and you can open the same build at /app/sprints. It runs on demo data.
How is sprint capacity computed?
From the team, not from a guess: each person has points per sprint and days off, and days off reduce effective points over the ten working days. Eli at 3 days off has 6 effective pts and 11 assigned: 183%, marked OVER on the Commit screen.
What is the commit-risk score?
A per-issue score with the reason attached. Remaining points times risk% sums to the expected fail (21 pts for Sprint 42) and the top-signal column prints the driver: unfinished carry-in, owner historical miss rate, backlog age, an add after sprint start.
What happens to work that does not finish?
It is forecast before it happens and counted after. The carry forecast reads 26 pts at close on day 6; the Cycles ledger records carry-out per sprint, so a pattern of leaking sprints is visible in the history.
Do retro actions just disappear after the meeting?
No. They are tracked as open items and surfaced into the next sprint: Sprint 42’s overview carries the alert “5 open retro actions: prior retro commitments still open into active sprint.”
Is Sprints audited or certified?
No certification has been issued. What we can evidence about hosting, encryption, tenant isolation and production access is written up on the security page.
Your next sprint has a capacity. Find out what it is.
Live build, demo data, no card. Then score the sprint you are sitting in right now.