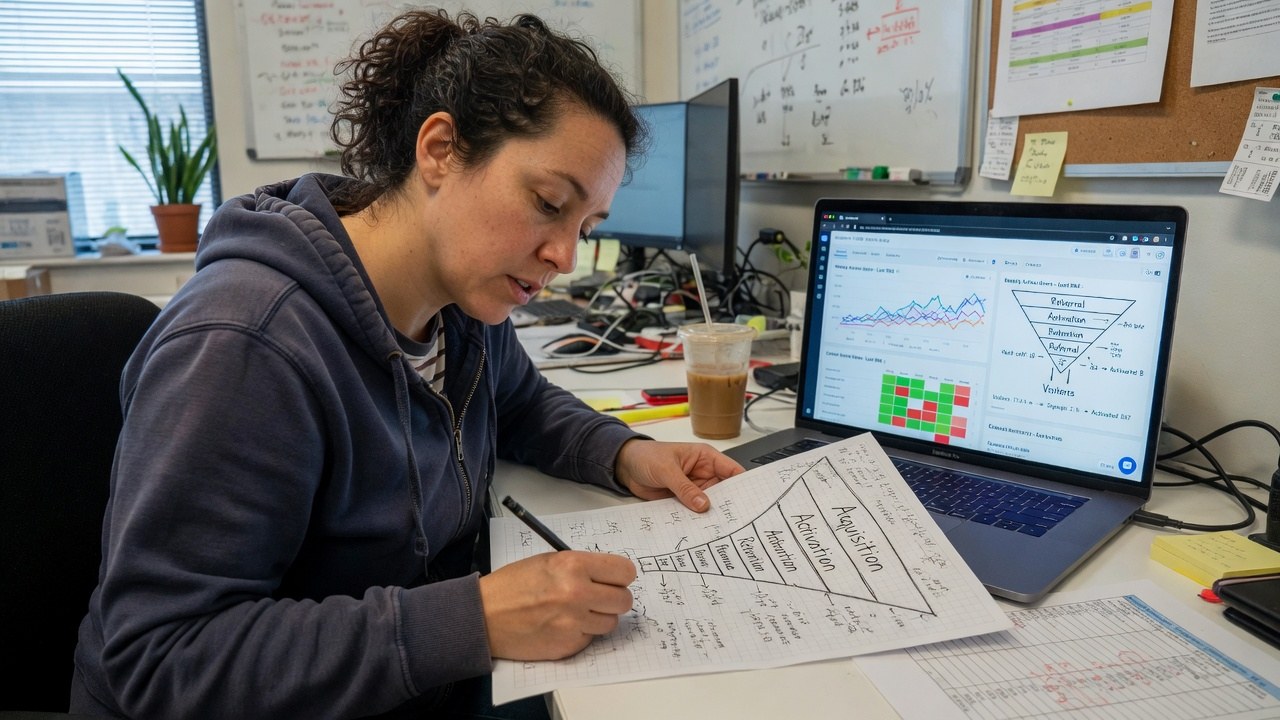
A growth analyst sketching an acquisition-to-retention funnel on paper beside a laptop showing a cohort grid and funnel chart in a product analytics tool.

CEDX Product Analytics · Data & Analytics

Watch the product
while it's being used.

Product Analytics turns the event stream into answers: activation and retention against the funnel, session replay ranked by friction score, and a live view of who is doing what, about four seconds behind reality.

The friction leaderboard doesn't average the pain away: the invite modal at 68, with 25 rage clicks and 19 dead clicks across four sessions. That's a fix list, not a metric.

product.cedxsystems.com — live build
CEDX Product Analytics overview: DAU, MAU, events per day, D7 retention, activation rate and core feature use cards, product health ring, events by category and event intensity.

Runs on demo data — the header reads “ingest lag ~4s · demo seed” on the screen itself.

18.4K DAU · 42.1K MAUstickiness 43.7% in the demo workspace
2.1M events a day9,000 a minute on the rolling live view
28.4% activationsignup → project, printed step by step

What it is

Behaviour, with the evidence attached.

The funnel, printed step by step

Goal mode shows conversion per step: signup completed at 100%, workspace created at 78%, project opened at 56%, task created at 39%. A free-plan D7 retention dip of −3.2pp gets an alert that names the day-2 empty project state as the cause.

  • Conversion per step, not just end-to-end
  • Retention, activation and feature use on one row
  • Alerts root-caused with the state named
product-analytics — overview
The funnel, printed step by step

Replay, ranked by friction

Sessions carry rage clicks, dead clicks and errors rolled into a friction score — 98 at the top of the queue. The leaderboard aggregates by screen: invite modal 68, upload dialog 63, timeline view 51.

  • 105 rage clicks across the queue
  • Friction per screen: rage, dead, errors
  • Error sessions flagged with toast seen
product-analytics — screen-3
Replay, ranked by friction

Live, four seconds behind

The Live screen streams the last 30 minutes: 1,284 active users, 9,000 events a minute, page_viewed leading at 412 users. The event feed reads like a log — and says demo stream on itself.

  • ~4s stream lag, stated on the header card
  • Top events now, per active user
  • Plan filter marked cosmetic in demo
product-analytics — screen-4
Live, four seconds behind

Product tour

Three screens, captured from the running build.

Not a mockup and not a concept deck. This is what opens at /app/product-analytics.

product.cedxsystems.com
CEDX Product Analytics Overview screen.CEDX Product Analytics Session replay screen.CEDX Product Analytics Live screen.

01 — Overview

The product's vital signs

DAU 18.4K, MAU 42.1K, 2.1M events a day, D7 retention 34.6%, activation 28.4%, core feature use 41%. Product health reads 88 with schema drift, dead events, stale flags and SDK lag itemized.

  • Health 88: drift 3 · dead events 5 · stale flags 4
  • Events by category: core 820K of the 30-day view
  • Annotations: boards v2 GA, onboarding rewrite

02 — Session replay

Where users actually struggle

28 queued sessions with friction signals, 9 scoring 60 or more. Each row shows duration, events, rage and dead clicks beside the score — 37 minutes in the invite modal with 13 rage clicks explains itself.

  • Scores beside the evidence
  • Leaderboard: invite modal 68 · upload dialog 63
  • Search by user, screen or email

03 — Live

The stream, unvarnished

task_created, page_viewed, flag_evaluated, invite_sent, plan_upgraded — twelve recent events with offsets in seconds, one of them an upgrade worth +$24 MRR. The footer admits the plan filter is cosmetic in the demo.

  • 12 recent events, seconds old
  • Users per minute, last 30 minutes
  • Stream lag ~4s on the card

Who runs it

Three roles keep the numbers honest.

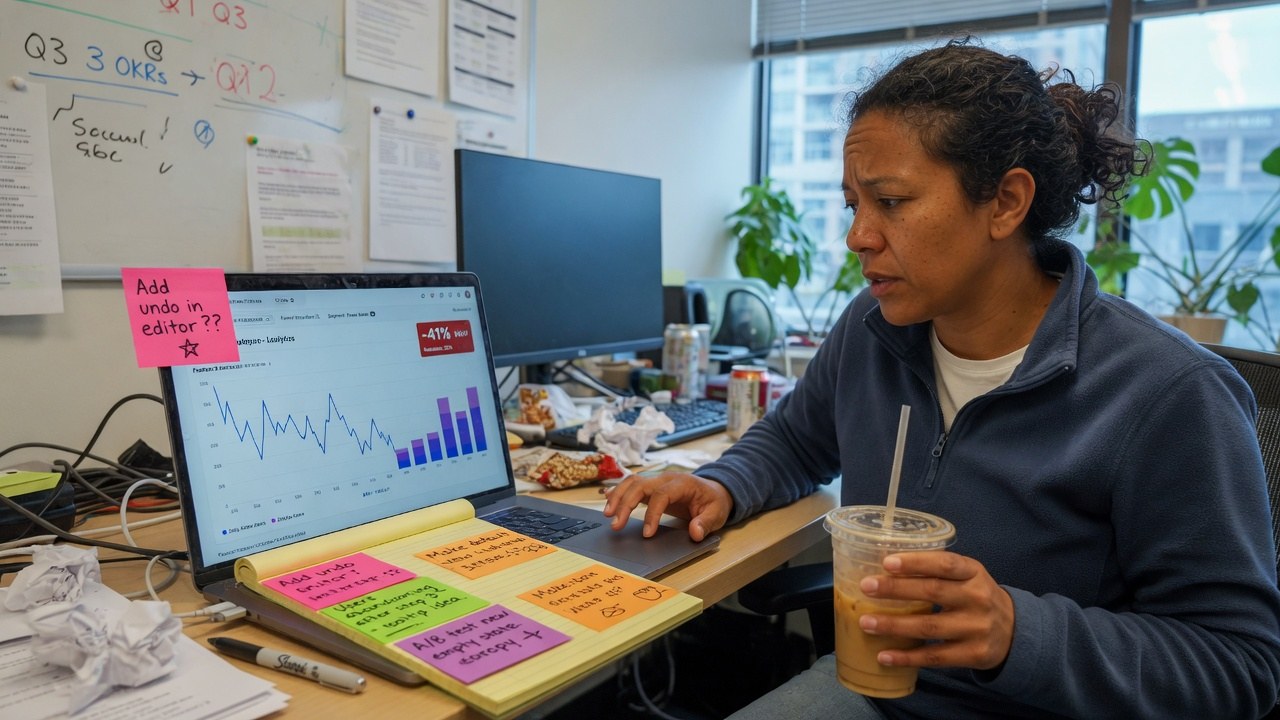
Roles, not references. We have no named customers yet, so nobody in these photographs is quoted, credited or claimed as one.

Growth and product

Owns activation: watches the 28.4% signup-to-project rate, the step where it leaks, and the alert when a rollout changes the shape.

activation · 28.4%

Product management

Reads replay before roadmap: the invite modal's 68 friction score and 25 rage clicks outrank opinion in the planning meeting.

friction · invite modal 68

Data and schema engineering

Keeps the event schema honest — 3 drift items, 5 dead events, 4 stale flags — so downstream numbers mean what they say.

schema drift · 3 open

The shape of it

What the demo product actually looks like.

Every figure below is legible in the captures above. Nothing here is a benchmark for your product — it is the state of the demo data.

18.4Kdaily active users42.1K MAU · 43.7% stickiness
34.6%D7 retentionnew users · free plan flagged −3.2pp
105rage clicks queuedacross 28 replay sessions
~4slive stream lagdemo seed, stated on screen
Events by category, 30 days2.1M events a day · where they come from
  • Core820K
  • Collab462K
  • Activation284K
  • Other186K
  • Billing124K
  • Flags98K
Activation funnel, conversion per stepgoal mode · signup to first task
  • signup_completed100%
  • workspace_created78%
  • project_opened56%
  • task_created39%
Core feature use41% of 7-day actives
  • Using core features · 41%
  • Not yet · 59%

How it runs

An event's life, in the order it actually happens.

01

Instrument

Events land with a governed schema — drift, dead events and stale flags are counted, not assumed away.

02

Measure

Activation, retention and feature use compute against the funnel; goal mode prints conversion per step.

03

Watch

Replay sessions rank by friction; rage and dead clicks roll up to a per-screen leaderboard.

04

Stream

Live shows the last 30 minutes with the lag on the card, so a launch's first hour is observable.

One record

Product behaviour joins
the estate's single record.

Product Analytics is not an isolated event bucket. Its stream feeds the same governed record the metric layer certifies and the warehouse stores.

All 132 applications

Limits

What Product Analytics does not do yet.

Finding this out on the third call is worse for you than reading it here, and worse for us.

Start

Open it before you talk to anyone.

Pilot

Your events, your funnel

  • Everything in Try
  • Event-schema workshop
  • Funnel and friction setup
  • Estate map
Talk to sales

Estate

Product Analytics with the rest of it

  • Product Analytics with Insight, Embedded and Sync
  • One identity, one bill
  • CEDX delivery
Book an estate map

Questions

Before you pilot Product Analytics.

Is the software on this page real?

Yes. Every screenshot is a capture of the running build, and you can open the same build at /app/product-analytics. It runs on demo data, which the header states on screen.

What is a friction score?

Rage clicks, dead clicks and errors rolled up per session, then aggregated per screen. The invite modal leads the leaderboard at 68 — 25 rage clicks and 19 dead clicks across four sessions — which makes it a fix list, not a metric.

How fresh is the Live screen?

About four seconds behind, and the header card says so. Users per minute covers the last 30 minutes; the event stream shows the twelve most recent events with offsets in seconds.

What counts as activation?

Signup to project — 28.4% in the demo workspace. Goal mode prints the funnel step by step: signup 100%, workspace created 78%, project opened 56%, task created 39%, so the leak has an address.

Is Product Analytics audited or certified?

No certification has been issued. What we can evidence about hosting, encryption, tenant isolation and production access is written up on the security page.

The stream is running. Watch your users, four seconds ago.

Live build, demo data, no card. Then check what your own invite flow's friction score would be.