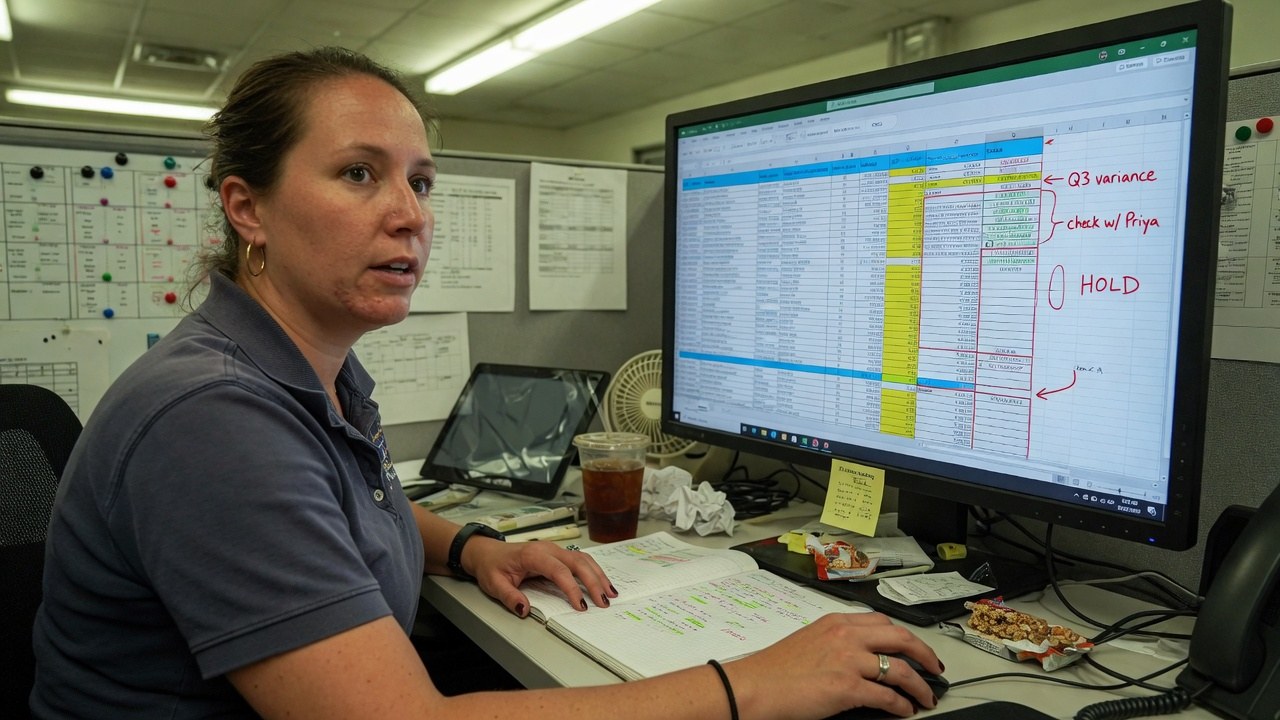
An analyst pointing at a wall-mounted dashboard of session trends and traffic sources while a colleague takes notes — the everyday argument a governed metric layer is built to settle.

CEDX Insight · Data & Analytics

The number is on the wall.
Now ask it why.

Insight is the governed metric layer for the estate: 320 certified metrics, an Ask screen that answers in plain language and prints the SQL it ran, and dashboards whose owners, tiles and view counts are on the record.

Every answer card on the Ask screen ends the same way — “How was this calculated?” — and opens the generated SQL. A number you can interrogate is a number you can defend.

insight.cedxsystems.com — live build
CEDX Insight overview: 320 active metrics, 17 published boards, weekly query spend, open drift, average freshness and cache hit rate cards, a warehouse load chart and root-caused alerts.

Runs on demo data — the header says “demo seed” on the screen itself.

320 governed metricsin the active catalog, across six domains
96% grounded answerstied to governed metrics, with the SQL shown
$4.8K query spend a weekthe warehouse bill, watched like a metric

What it is

A metric layer, not another chart folder.

Ask in plain language, audit the SQL

The Ask screen answers “Why did net revenue drop last week?” with $4.20M, down 4.2% — and attributes it to EU wholesale and the promo channel, “not a definition change”. Below the answer: the generated SQL, the freshness stamp and the metric owner.

  • Generated SQL printed under every answer
  • Freshness 2h and owner FP&A on the answer card
  • Follow-ups and suggested questions stay in scope
insight — screen-3
Ask in plain language, audit the SQL

Drift is a number, not a feeling

44 open drift items sit on the overview next to an average freshness of 18.1h against a 4-hour metric SLA and a 44% cache hit rate. The alerts arrive root-caused: semantic model v4 changed credit allocation on Aug 12, and the net revenue alert says so.

  • 44 open drift, value plus definition
  • 18.1h average freshness against a 4h SLA
  • Alerts name the cause, not just the dip
insight — overview
Drift is a number, not a feeling

Dashboards with owners, not orphans

42 dashboards carry domain, owner, tile count, 30-day views and status on every row — Executive pulse at 2.4K views published, Working capital archived at 2.3K. Published, draft, scheduled and archived are filter chips, not guesses.

  • Domain, owner and tiles on every row
  • Views over 30 days, sortable
  • Published, draft, scheduled, archived chips
insight — screen-4
Dashboards with owners, not orphans

Product tour

Three screens, captured from the running build.

Not a mockup and not a concept deck. This is what opens at /app/insight.

insight.cedxsystems.com
CEDX Insight Overview screen.CEDX Insight Ask screen.CEDX Insight Dashboards screen.

01 — Overview

The health of the metric estate, on one screen

320 active metrics, 17 published boards of 42, $4.8K weekly query spend, 44 open drift. The BI health ring reads 68, and the alert list underneath explains itself: net revenue −4.2% vs baseline — why: semantic model v4 changed credit allocation on Aug 12.

  • BI health 68, with the components listed
  • Late datasets 5, waste queries 8, cache hit 44%
  • Alerts arrive root-caused, spend attached

02 — Ask

Plain question in, auditable answer out

148 questions a day across workspaces, 96% grounded in governed metrics, 3.2s median answer time. The answer card for net revenue shows the metric chip net_revenue at −4.2%, a freshness stamp of 2h and the owner — FP&A.

  • 148 questions today, 3.2s median answer
  • SELECT day, SUM(order_total) − SUM(refunds) − SUM(credits) AS net_revenue
  • “How was this calculated?” opens the working

03 — Dashboards

42 boards, each with a pulse

Executive pulse leads at 2.4K views over 30 days with 14 tiles; Warehouse ops carries 22; Churn autopsy 23. The same table shows archived boards still pulling views — Working capital at 2.3K — so retirement is an evidence decision.

  • 42 dashboards, 15 average tiles per board
  • 33K views across the current view
  • CSV export of the table you are looking at

Who runs it

Three roles keep the metrics honest.

Roles, not references. We have no named customers yet, so nobody in these photographs is quoted, credited or claimed as one.

FP&A and metric owners

Owns the certified definitions. When net revenue moves 4.2%, the answer card names them as owner and the drift queue says whether it was the business or the definition.

net_revenue · −4.2% w/w

Analytics engineering

Watches freshness and spend: 18.1h average against a 4h SLA, $4.8K a week in queries, and the waste-query list that says which of the 320 earn their keep.

freshness 18.1h · SLA 4h

Catalog stewardship

Keeps the 320-metric catalog governable — definitions, domains and certification — so the Ask screen has something solid to ground against.

catalog · 320 metrics

The shape of it

What the demo workspace actually looks like.

Every figure below is legible in the captures above. Nothing here is a projection of your estate — it is the state of the demo data.

320governed metrics in the catalog92 revenue · 74 ops · 58 finance
148questions asked today96% grounded · 3.2s median
42dashboards on the record17 published · 15 avg tiles
$4.8Kweekly query spendwaste queries named in alerts
Metrics by domain, catalog share320 governed metrics · where they live
  • Revenue92
  • Ops74
  • Finance58
  • Product44
  • Customer36
  • Supply28
BI healthfreshness + drift + cost · +1 vs prior week
68
  • Cache hit · 44% of the query layer
  • Drag: 5 late datasets · 8 waste queries · 44 open drift
Grounded answers96% tied to governed metrics
  • Grounded · 96%
  • The remainder, flagged rather than smoothed over

How it runs

A metric's life, in the order it actually happens.

01

Certify

A metric enters the catalog with a definition, a domain and an owner — 320 of them, 92 in revenue alone.

02

Ask

Questions run against the governed layer: interpret, generate SQL, answer with freshness and owner attached.

03

Watch

Drift, freshness and spend are scored continuously; a definition change raises a root-caused alert, not a mystery dip.

04

Publish

Boards move from draft to published with owners and view counts following them — and stale boards get archived on evidence.

One record

The metrics are certified once
and read everywhere.

Insight is not a chart tool with an import button. The 320 metrics are the estate's shared definitions — the same numbers the warehouse stores, reports deliver and embeds render.

All 132 applications

Limits

What Insight does not do yet.

Finding this out on the third call is worse for you than reading it here, and worse for us.

Start

Open it before you talk to anyone.

Pilot

Your metrics, governed

  • Everything in Try
  • Metric-catalog workshop
  • Drift and SLA setup
  • Estate map
Talk to sales

Estate

Insight with the rest of it

  • Insight with Warehouse, Reports and Embedded
  • One identity, one bill
  • CEDX delivery
Book an estate map

Questions

Before you pilot Insight.

Is the software on this page real?

Yes. Every screenshot is a capture of the running build, and you can open the same build at /app/insight. It runs on demo data, which the header states on screen rather than in a disclaimer.

Where do the Ask answers come from?

From the governed semantic catalog, and only from it — 320 metrics in scope, stated on the Ask screen. The answer card for net revenue names the metric (net_revenue), its freshness (2h) and its owner (FP&A), and prints the generated SQL underneath.

What happens when a metric definition changes?

It raises drift, not confusion. When semantic model v4 changed credit allocation on Aug 12, the overview raised a root-caused alert tying the net revenue move to that change — “boards still use mixed grain” — rather than letting the number quietly shift.

Can we see which dashboards people actually read?

Yes. Every board carries 30-day views: Executive pulse at 2.4K published, Working capital at 2.3K archived and still being read. Retirement and promotion decisions get made from the same table.

Is Insight audited or certified?

No certification has been issued. What we can evidence about hosting, encryption, tenant isolation and production access is written up on the security page.

The metric layer is running. Ask it something hard.

Live build, demo data, no card. Start with the question your Monday meeting argued about.