48.2 million rows a day. Every minute of lag counted.
Sync moves data from sources into the warehouse estate: 72 jobs, 48 connectors, per-job freshness SLAs, and a breach queue that names the worst offender instead of averaging it away.
The Lag & freshness screen leads with its worst row: returns-com→wh-core-26 at 92 minutes against a 45-minute SLA. Pipeline honesty is a breach queue, not an uptime badge.
sync.cedxsystems.com, live build
Runs on demo data: the header reads “warehouse lag ~14m · demo seed” on the screen itself.
48.2M rows a day77.9M on the rolling daily snapshot
97.8% of runs succeedacross 7 days of demo runs
14m p95 lagagainst a 15-minute freshness line
What it is
Movement you can hold to a clock.
Lag against SLA, per job
Every job carries mode, lag, SLA and rows per day: returns-com→wh-core-26 runs incremental at 92m against 45m and is marked degraded; the events archive appends 6.4M rows a day at 90m against a 180m SLA and stays healthy.
Modes: full refresh, incremental, append only, CDC
Lag, SLA and rows/day on every row
Paused, degraded, healthy, not just green
sync screen-3
48 connectors, typed and counted
The connector list carries type, domain, table count, rows per day, lag and status: file drops, database CDC, SaaS extracts, APIs and webhooks. The events archive leads volume at 6.4M rows a day across 8 tables.
Types: S3 and GCS files, MySQL and Postgres CDC, SaaS extract, API, webhook
Rows/day and lag per connector
11 of 48 need attention, counted on screen
sync screen-4
Drift is watched, not discovered
18 tables sit in open drift, and the alert feed names the CRM-to-warehouse job at 48 minutes against a 30-minute SLA with the reason attached: full-refresh mode on 64 tables cannot finish inside the 6-hour schedule.
18 open drift tables · 45 on the health ring
MAR bill projection, deletes billed
Root-caused alerts with the failing mode named
sync overview
Product tour
Three screens, captured from the running build.
Not a mockup and not a concept deck. This is what opens at /app/sync.
sync.cedxsystems.com
01 Overview
The pipeline's vital signs
48.2M rows a day, 97.8% success, 14m p95 lag, 72 active jobs of 78 registered, 7 failed runs in 24 hours. Pipeline health reads 93 with the components (drift tables, failed runs, breach jobs, average lag) listed beside it.
Health 93, components enumerated
Rows by domain over 30 days
Annotations: warehouse resize, CDC orders GA
02 Lag & freshness
The breach queue is the work list
p95 lag at 86m across all jobs, 24 of 72 breaching SLA. The queue sorts worst-first with the SLA it broke and the rows it carries: 92 minutes against 45, at 1.4M rows a day, on top.
24 SLA breaches of 72 jobs
Freshness trend against the 15-minute line
Worst job named on the header card
03 Connectors
Sources, typed and totaled
48 connectors across commerce, payments, support, inventory and marketing. The checkout extract shows failed at 39m lag; the Postgres orders CDC connector runs 42 tables at 6m lag, healthy.
48 connectors · 79.2M rows/day in view
Status per connector, 14-day trend per row
Filter chips by domain and health
Who runs it
Three roles keep the rows moving.
Roles, not references. We have no named customers yet, so nobody in these photographs is quoted, credited or claimed as one.
Pipeline operations
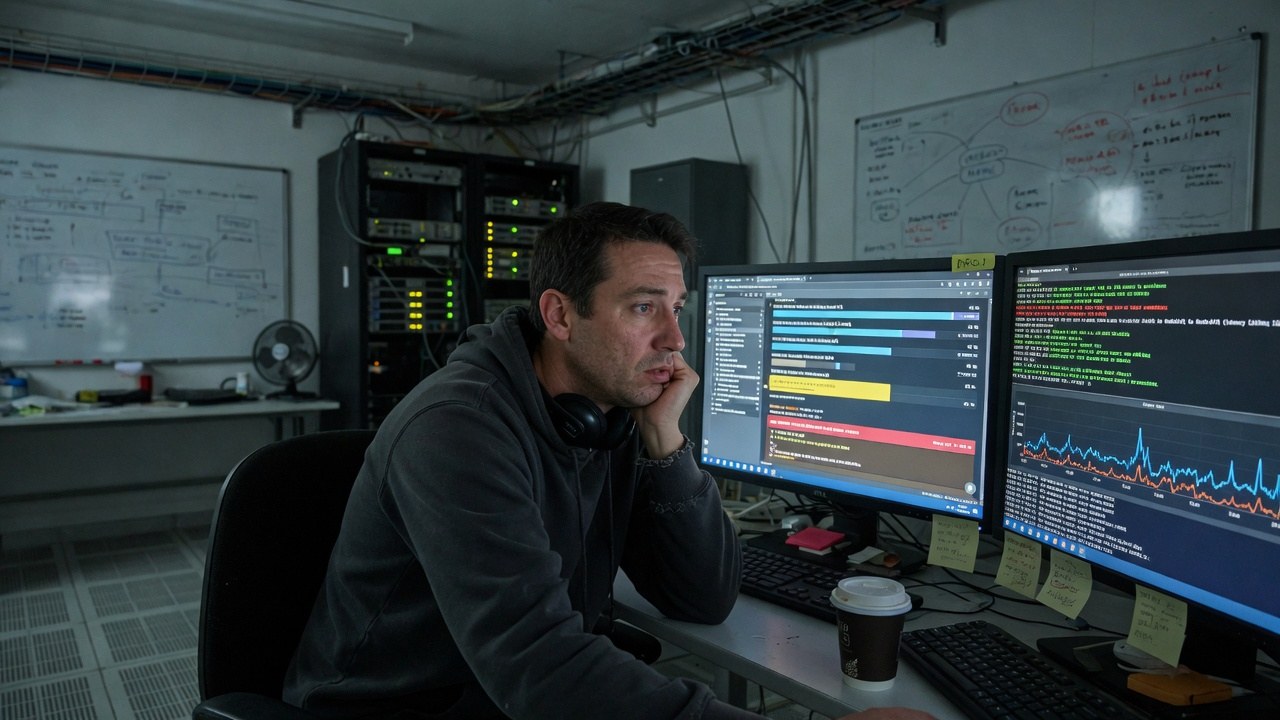
Owns the breach queue: rallies the 7 failed runs, works the 24 SLA breaches worst-first, and watches the CRM job's 48-minute lag against its 30-minute SLA.
breach queue · 24 jobs
Integration engineering
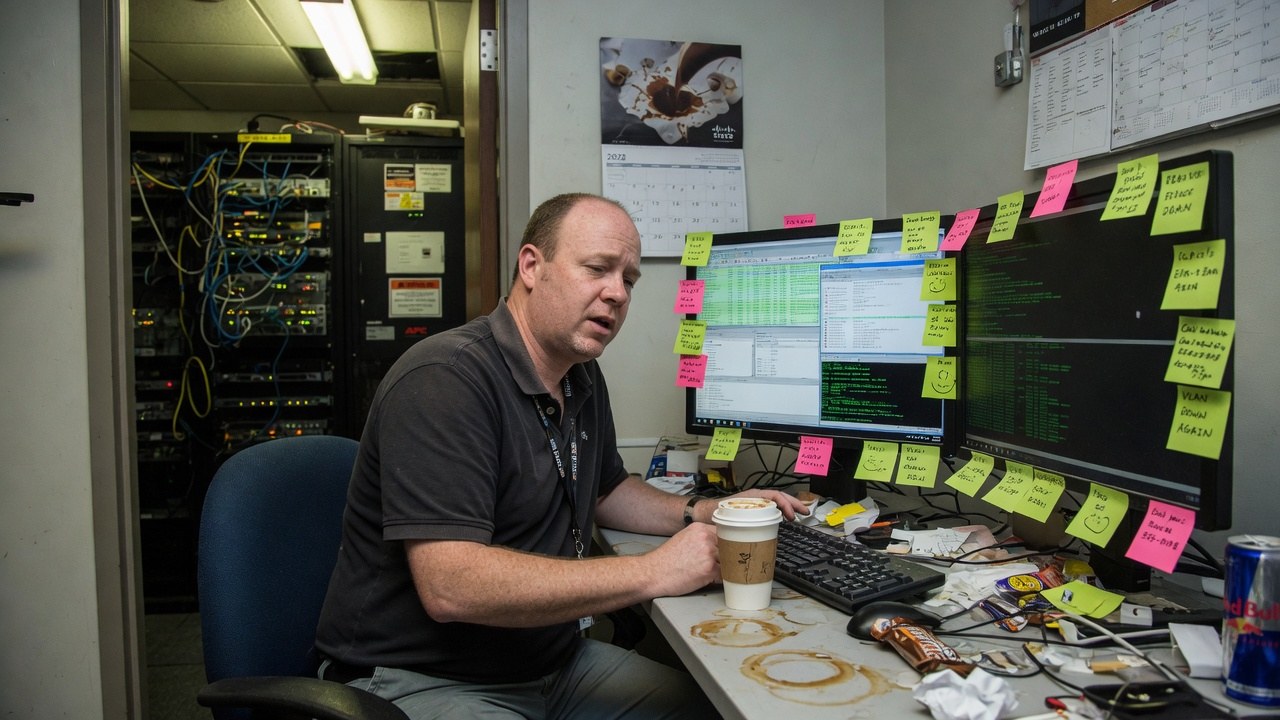
Maintains the 48 connectors (credentials, modes and schedules) and reads the drift list before the business does.
connectors · 11 unhealthy
Data ownership
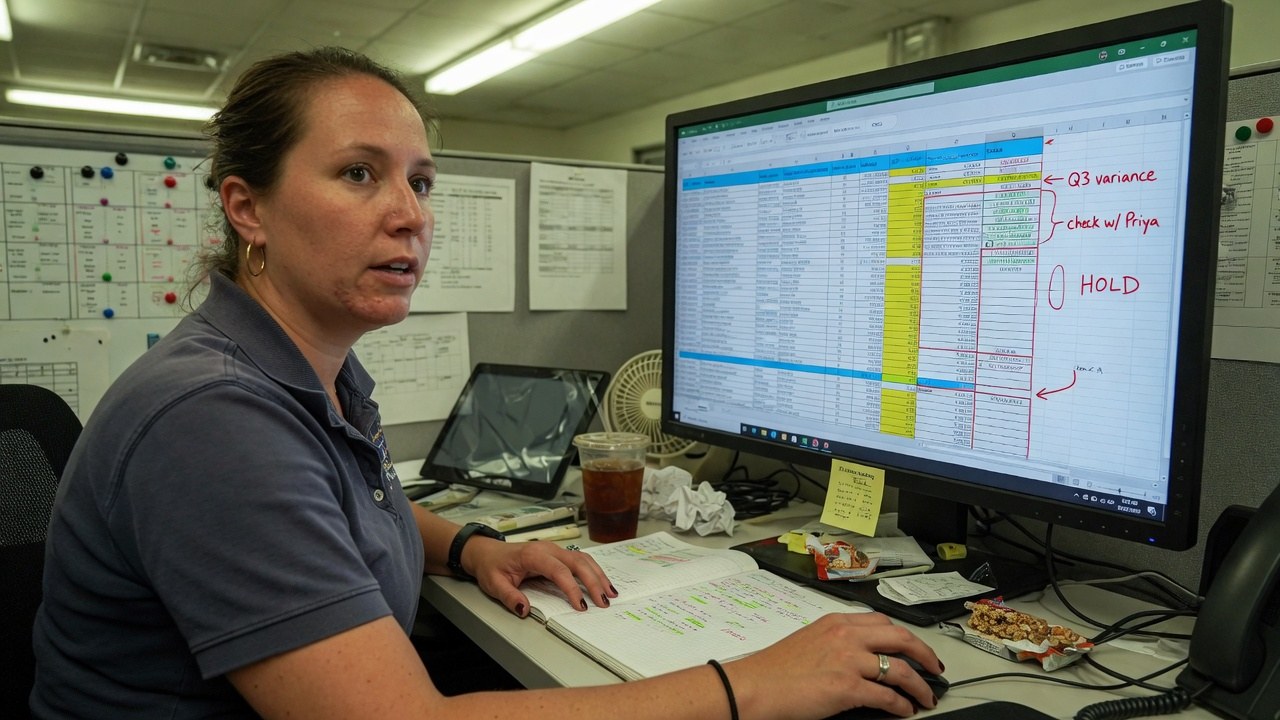
The domain teams who consume the rows. They see lag and drift on the same screens engineering does, so “the data is stale” has a number attached.
open drift · 18 tables
The shape of it
What the demo pipelines actually look like.
Every figure below is legible in the captures above. Nothing here is a projection of your estate. It is the state of the demo data.
48.2Mrows synced a day77.9M on the rolling snapshot
72active jobsof 78 registered · 24 breaching SLA
92mworst job lagreturns-com→wh-core-26 · SLA 45m
$4,601projected MAR billfrom the backfill model · deletes billed
Rows by domain, 30 dayswhere the volume actually sits
A row's journey, in the order it actually happens.
01
Connect
A source becomes a typed connector (files, CDC, extract, API or webhook) with tables and a schedule.
02
Move
Jobs run in their mode (full refresh, incremental, append-only or CDC) carrying rows per day and lag with them.
03
Measure
Lag is compared to each job's SLA continuously; breaches sort into the queue worst-first.
04
Recover
Failed and partial runs rally from the overview. The alert says why: full-refresh mode on 64 tables cannot fit the 6-hour window.
One record
The plumbing behind every number the estate shows.
Sync is not an import wizard. Its jobs, lags and drift flags are the same record the warehouse's freshness SLAs and the metric layer's freshness figures are computed from.
Finding this out on the third call is worse for you than reading it here, and worse for us.
Sync is not generally available. What opens today is the live build running on demo data: the workspace named on screen is the demo seed.
We have no named customers to show you, so this page shows none. The source and job names in the captures are demo seeds, not references.
The connector catalog shown (48 connectors across file, CDC, extract, API and webhook types) is the demo estate's. The full supported-source matrix is a pilot conversation, not a claim on this page.
The MAR projection, $4,601, comes from the demo backfill billing model. It is not a price list.
Sync moves data; transformation modelling lives elsewhere in the estate and is not claimed here.
No audit or compliance certification has been issued. What we can evidence about hosting, encryption and access is on the security page.
Yes. Every screenshot is a capture of the running build, and you can open the same build at /app/sync. It runs on demo data, which the header states on screen.
What happens when a job breaches its SLA?
It sorts into the breach queue with its lag, its SLA and its rows per day, worst first, and the worst job is named on the header card. The alert root-causes it: the CRM job's 48-minute lag traces to full-refresh mode on 64 tables not fitting the 6-hour schedule.
Which source types are supported?
The connector screen shows the demo estate's types: S3 and GCS files, MySQL and Postgres CDC, SaaS extracts, APIs and webhooks. What we support for a given source of yours is a pilot conversation. This page does not claim a matrix.
How is drift different from lag?
Lag is time: how far behind its SLA a job is. Drift is divergence: rows that no longer match between source and destination. 18 tables sit in open drift, and the contacts table is flagged at 2.4% row drift in the alert feed.
Is Sync audited or certified?
No certification has been issued. What we can evidence about hosting, encryption, tenant isolation and production access is written up on the security page.
The jobs are running. See which one is worst.
Live build, demo data, no card. The breach queue sorts itself worst-first, which is the only honest way to sort it.