CEDX ITSM runs incidents, problems, changes and major incidents off one record. Every row carries an AI-suggested group and a response clock, and when fourteen incidents are really one outage, the Major blast view says so.
The Overview does not hide the bad news: 189 breached, 91 at risk, 50 unassigned, next to the 154 conversations the portal agent deflected today with no human touch. Both numbers are on the same screen.
itsm.cedxsystems.com, live build
Runs on demo data: the workspace is the software's Northline sample, not a customer.
320 incidents in the workspace187 open, 50 waiting to be claimed
42% deflection rate154 portal conversations deflected today, no human touch
14 incidents, one blastMI-12 correlates them across 8 services and 5 sites
What it is
A service desk that shows its working.
Every incident carries a suggestion and a clock
The queue lists 320 incidents with priority, status, group and an AI-suggested assignment on every row. INC-2637 “Wifi controller offline during freeze” comes with P3 · Network at 75% confidence. The wait and response-left columns are honest about it: 15.9h past.
AI suggest with confidence on every row
Response-left printed even when it is past
All, Open, P1-P2, Unassigned, Breached as saved tabs
itsm: screen-2
27 known errors, each with a workaround
Problems is a library, not a graveyard: 64 problems, 53 open, 27 marked known error with a workaround attached. Recurring noise becomes a systemic record, “KE disk full warning. Systemic”, with the incident count against it.
Known error 27 · with workaround, on the card
No RCA yet as its own filter tab
Incident count per problem, 9 down to 7 in view
itsm: screen-3
A commander view for the day it all goes wrong
MI-12 is a SEV-1 auth-gateway outage on the prod edge. The blast view names the commander, the start time and the age, correlates 14 incidents across 8 services and 5 sites, and simulates severity: 98 pre-levers, 76 residual with one lever pulled.
Commander, started 2026-08-04 06:12, age on screen
Base severity 98 → residual 76, simulated
Commander, Blast map, Comms, Containment sim tabs
itsm: screen-4
Product tour
Four screens, captured from the running build.
Not a mockup and not a concept deck. This is what opens at /app/itsm.
itsm.cedxsystems.com
01 Overview
The state of the service, good and bad
187 open incidents, 86 of them P1-P2, 91 at SLA risk with breach probability over 55%, and a median P1-P2 age of 16.0 hours. Next to it, the deflection story: 154 handled by the portal agent today, $3.8K of agent handling avoided this week.
SLA health ring: 42% within SLA, on screen
Deflected, agent-handled and cost avoided side by side
Changes at risk ≥60 flagged for the CAB window
02 Incidents
The queue is a working surface
Filter chips for P1 through P4, New, In progress and On hold sit above the table; search takes an incident number, a CI or a service. The view exports to CSV: the view you were actually looking at, not a report someone else runs.
Search incidents, CI, service or number
AI-suggested group with confidence per row
CSV export of the filtered view
03 Problems
Where recurring incidents go to be understood
64 problems in the library, each with status, priority, owner and the service it keeps hurting: shared storage, analytics, email, the auth gateway. The known-error toggle isolates the 27 with workarounds from the ones still waiting on a root cause.
Investigating, Root cause, Known error, Pending change
Owner and service on every row
Known-error-only toggle on the filter bar
04 Major blast
Fourteen incidents, one conversation
Instead of fourteen assignees discovering the same outage, the commander sees the correlated set: auth gateway 5xx on prod edge, SSO redirects failing for warehouse tablets, login timeouts at the storefront. One blast, one primary incident, one comms channel.
14 correlated incidents with site per row
8 services in blast, 5 regions
Containment sim before you pull the lever
Who runs it
Three roles keep the queue honest.
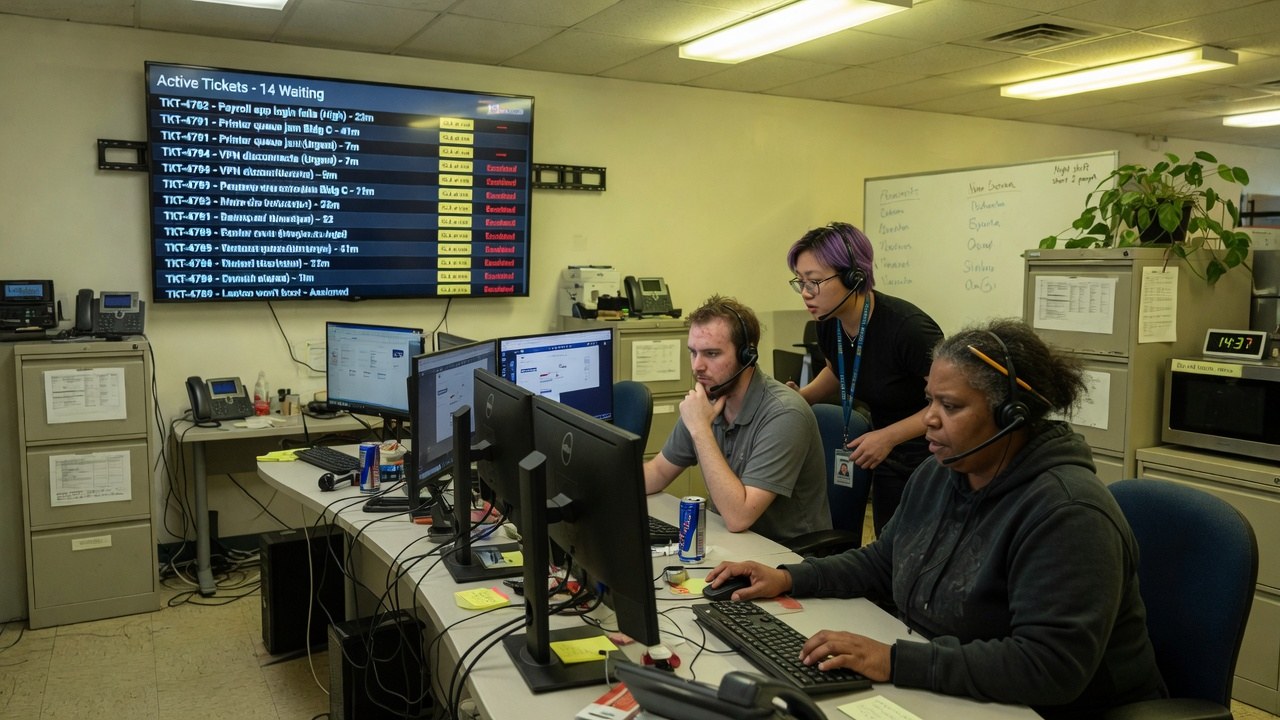
Roles, not references. We have no named customers yet, so nobody in these photographs is quoted, credited or claimed as one.
Service desk lead
Works the queue by the response clock, claims the 50 unassigned, and watches the deflection rate to see what the portal agent is actually absorbing.
unassigned · 50
Incident and problem analyst
Turns the third “wifi controller offline” incident into a problem record with a workaround, so the fourth one closes itself.
known errors · 27
Major incident commander
Runs MI-12 from the blast view: correlated incidents, services hit, comms, and a containment simulation before anything gets pulled.
residual SIM · 76
The shape of it
What the demo workspace actually looks like.
Every figure below is legible in the captures above. Nothing here is a projection of your estate. It is the state of the demo data.
Major blast services, MI-12severity · incidents in blast, from the Overview
Auth gateway: the failing service, SEV 983 incidents
Perimeter: SEV 98, collateral in the same blast4 incidents
Monitoring: SEV 94, watchers going blind mid-incident2 incidents
Identity and Remote access: SEV 82 each1 each
Portal conversations, today154 deflected of 368 total conversations
Deflected by portal agent · 154, no human touch
Agent-handled · 214 conversations today
SLA health42% within SLA · 189 breached · 91 at risk
42%
Open and within SLA · 42% of the clock attainment ring
Breached 189 · at risk ≥55% 91 · unassigned 50
How it runs
An incident's life, in the order it actually happens.
01
Deflect
The portal agent takes the first conversation (154 deflected today at a 42% rate), and what it cannot resolve lands in the queue with context attached.
02
Triage
Each incident gets an AI-suggested group with a confidence figure, and the response clock starts. P1-P2 is its own tab, not a filter someone forgot to save.
03
Correlate
Recurring symptoms roll up into problems and known errors; a real outage rolls up into a major blast with a named commander and a correlated incident set.
04
Review
SLA attainment, median age and changes at risk are on the same Overview the team opened at standup: the review is the screen, not a deck built from it.
One record
The queue reads the estate it sits on.
An incident is only as good as what it knows about the device, the person and the change behind it. That context is what the rest of the estate writes.
Finding this out on the third call is worse for you than reading it here, and worse for us.
ITSM is not generally available. What opens today is the live build on demo data. The Northline workspace in the captures is the software's sample, not a customer.
We have no named customers to show you, so this page shows none. The people in the photographs are roles, not references.
The deflection and cost-avoided figures (42%, $3.8K) are the demo workspace's own numbers, printed on its Overview. They are not a benchmark we are claiming for your estate.
The AI suggestions on the queue are suggestions with a visible confidence figure, not auto-assignment; whether your plan enables anything stronger is not something this page claims.
No audit or compliance certification has been issued for ITSM. What we can evidence about hosting, encryption and access is on the security page.
Yes. Every screenshot is a capture of the running build and you can open the same build at /app/itsm. It runs on demo data: the Northline workspace is the sample tenant.
What does the portal agent actually do?
It takes the first conversation and resolves what it can without a human: 154 deflected today at a 42% deflection rate, against 214 that went to agents. Both numbers are on the Overview, so you can judge the mix yourself.
How does a major incident work?
When correlated incidents point at one cause, the Major blast view groups them: a named commander, a primary incident, the services and sites in blast, comms, and a containment simulation that shows severity before and after each lever: 98 down to 76 on MI-12.
What is the difference between a problem and a known error?
A problem is the record for a recurring or systemic cause; a known error is a problem with a confirmed root cause and a workaround attached. The library holds 64 problems, 27 of them known errors, and “No RCA yet” is its own tab.
Is ITSM audited or certified?
No certification has been issued. What we can evidence about hosting, encryption, tenant isolation and production access is written up on the security page.
The queue is running. Go and look at it.
Live build, demo data, no card. Then compare it with the queue your team worked this morning.