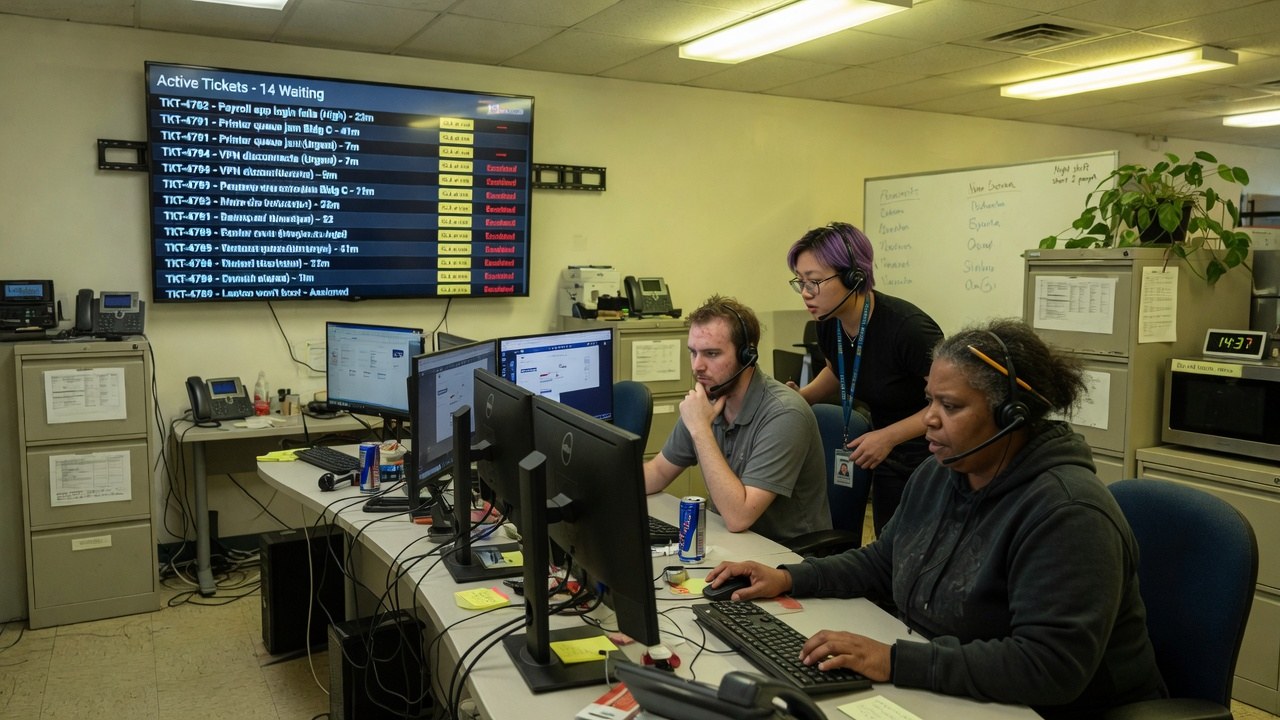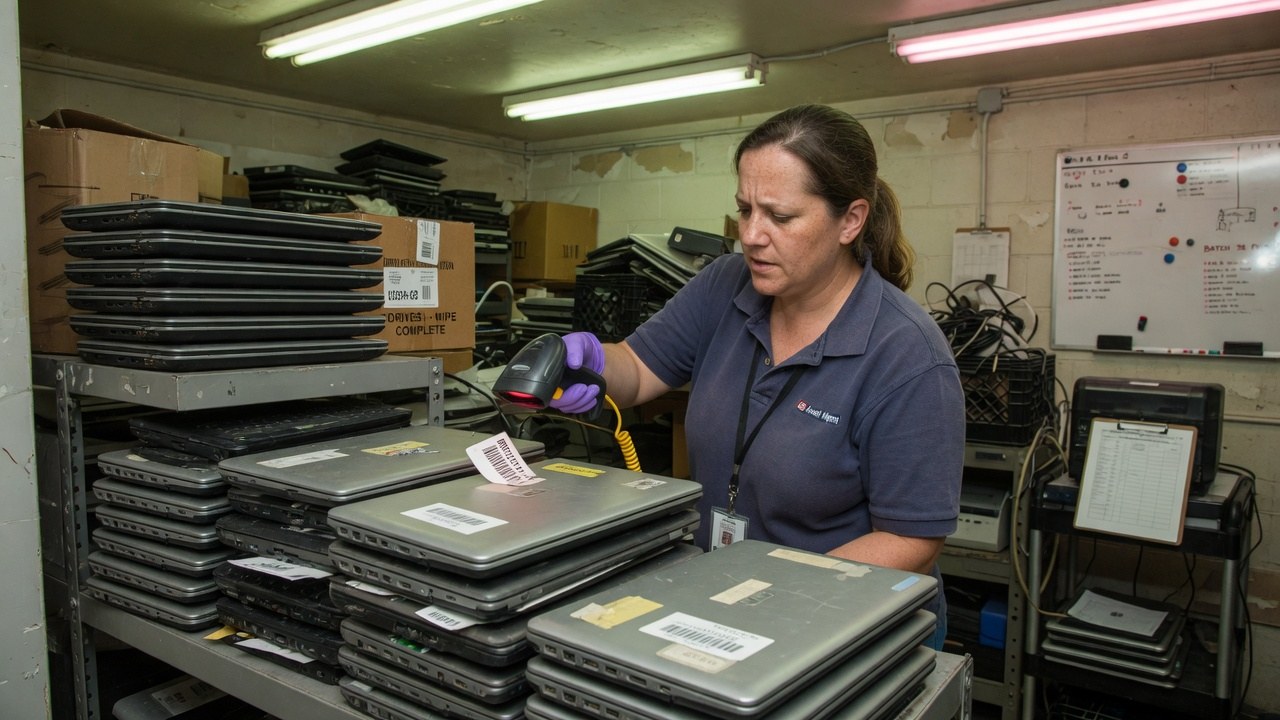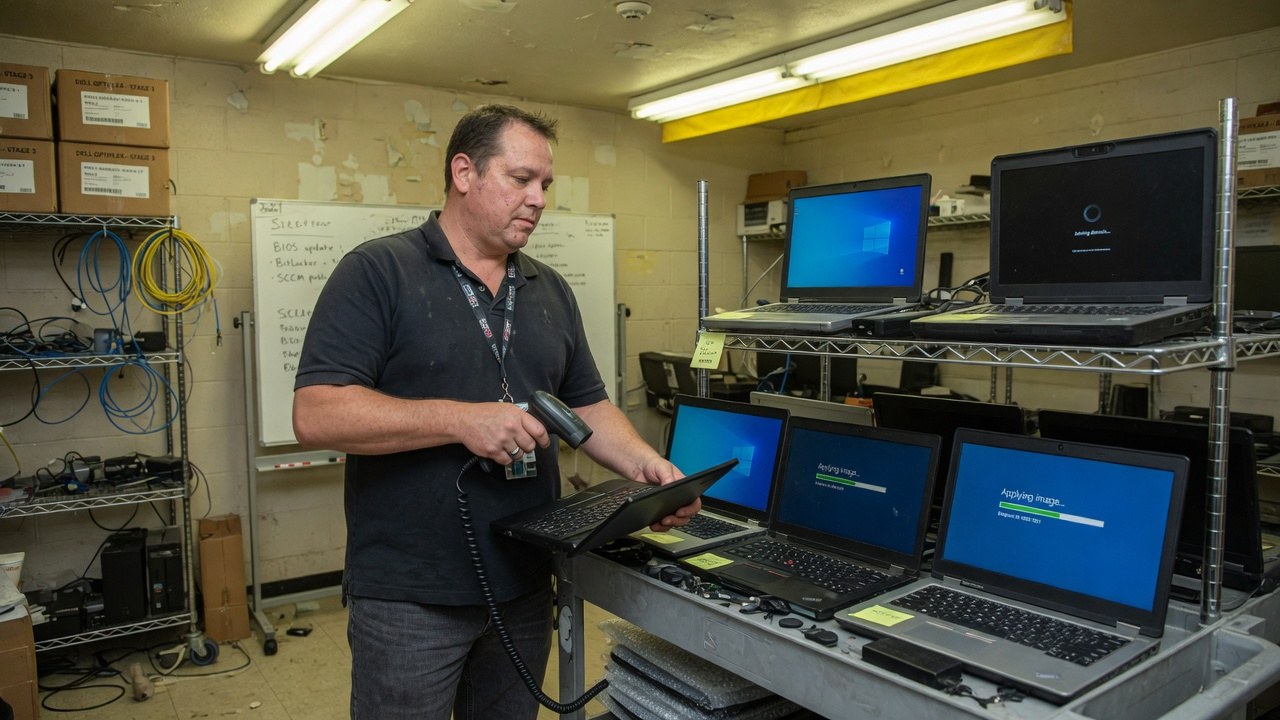
A technician imaging a cart of laptops in a staging room — the unglamorous start of fleet management.

CEDX Endpoint · IT & Security

320 devices. Each one
with a score and a reason.

CEDX Endpoint scores every device for exposure, tracks patch lag in days, and puts an agent's verdict next to every detection — benign, suspicious, malicious, with the confidence printed. Nothing is hidden behind a colour.

The agent investigated 39 detections this week and proposed 5 actions. 4 are still waiting for a human. That queue — proposed, pending, approved — is the product.

endpoint.cedxsystems.com — live build
CEDX Endpoint overview: device count, online devices, high exposure, open detections, critical CVE hosts, sensor coverage and the posture ring.

Runs on demo data — Northline is the software's sample fleet, not a customer.

46 high-exposure devicesscore ≥55, each with its top signal named
102 open detections15 of them critical, verdicts on every row
67.5% sensor coverage289 of 320 online — the gap is on the same card

What it is

Posture you can argue with, row by row.

Exposure is a queue, not a vibe

The exposure queue ranks all 320 devices with owner, OS, score, patch lag and the top signal behind the score. finance-kiosk-02 sits at 94 with a 112-day lag and five critical CVEs open on the host — and the remediation simulator is the next tab over.

  • Score, lag in days, critical count per device
  • Top signal on every row — no unexplained numbers
  • Patch lag board, simulator and scoring model as tabs
endpoint — screen-2
Exposure is a queue, not a vibe

Detections with the verdict attached

180 detections in the stream, 102 open, 15 critical. Each row names the behaviour — mass file encryption, outbound C2 beacon, sensor tamper — with tactic, status and the agent's verdict: malicious 82%, suspicious 78%, benign 55%.

  • Tactic and confidence on every detection
  • Contained, open and false-positive states distinct
  • 125 blocked or contained, auto plus analyst
endpoint — screen-4
Detections with the verdict attached

The fleet, including the gaps

The device list is honest about coverage: 289 of 320 online, 31 offline, 15 isolated, sensor coverage 67.5%. A device you cannot see is not presented as a device you can.

  • Online yes/no and last seen on every row
  • Isolated devices counted on the card, not hidden
  • Critical, high, medium, low as severity chips
endpoint — screen-3
The fleet, including the gaps

Product tour

Four screens, captured from the running build.

Not a mockup and not a concept deck. This is what opens at /app/endpoint.

endpoint.cedxsystems.com
CEDX Endpoint Overview screen.CEDX Endpoint Exposure screen.CEDX Endpoint Devices screen.CEDX Endpoint Detections screen.

01 — Overview

Fleet posture on one screen

320 devices, 289 online, 46 high-exposure, 130 hosts with an unpatched critical CVE. The posture ring reads 66 — pulled down by a 35-day average patch lag and the 101 devices lagging 45 days or more.

  • Detections versus blocked, daily, with event markers
  • Fleet by OS: Windows 121, macOS 71, Linux 64, mobile 64
  • Agent activity: 39 investigated, 4 awaiting approval

02 — Exposure

Where the risk actually sits

Average exposure across the fleet is 34; the top of the queue is a build runner at 95 and a kiosk at 94 with 112 days of lag. The simulated-high card shows what the board looks like with no levers pulled.

  • Min-exposure chips: all, ≥40, ≥55, ≥70
  • Owners on every row — a person, not a hostname alone
  • Simulated high 46 · no levers, stated on the card

03 — Devices

Every device, owner and last seen

The full fleet table: device, owner, OS, online state, exposure, lag, risk and last seen. Sort by exposure and the top of the list matches the queue on the Exposure screen — same record, two views.

  • CSV export of the filtered view
  • Last seen to the day, 2026-08-04 at the top
  • Risk column separate from the exposure score

04 — Detections

The stream, triaged

RDP brute force from jules-iphone-5 came in as a false positive — benign 55%. The PowerShell encoded command on zion-tab-44 is contained, suspicious 78%. The mass file encryption behaviour on quinn-desk-82 is the one you work first: malicious 82%.

  • Critical, high, medium, low, info severity chips
  • Search detections or hosts directly
  • Blocked/contained 125 · auto + analyst, on the card

Who runs it

Three roles keep the fleet honest.

Roles, not references. We have no named customers yet, so nobody in these photographs is quoted, credited or claimed as one.

Fleet engineer

Owns sensor coverage and imaging — the 67.5% coverage figure and the 31 offline devices are theirs to move.

sensor coverage · 67.5%

Security analyst

Works the detection queue by verdict and confidence, approves or overrides the agent's proposed actions, and owns the 15 open criticals.

open critical · 15

IT asset owner

Reconciles the scored fleet with the physical estate — every device with an owner, every owner with a device.

devices · 320

The shape of it

What the demo fleet actually looks like.

Every figure below is legible in the captures above. Nothing here is a projection of your estate — it is the state of the demo data.

320devices scored289 online · 31 offline
35daverage patch lag101 devices at 45 days or more
102open detections15 critical · 125 contained
4actions awaiting approvalof 5 the agent proposed this week
Detections by severity, this weekfrom the Overview's severity mix
  • Medium — the bulk of the stream57
  • High — including the file-encryption behaviour50
  • Critical — work these first28
  • Low — triage when the queue allows26
  • Info — context for the rest19
Fleet by operating systemWindows 121 of 320 devices
  • Windows · 121
  • macOS 71 · Linux 64 · Android 33 · iOS 31
Sensor coverage289 of 320 online with a running agent
67.5%
  • Online with agent · 289 devices
  • Offline or unagented · the 32.5% the posture score counts against you

How it runs

A detection's life, in the order it actually happens.

01

Score

Every device gets an exposure score from its open CVEs, lag and behaviour — the queue re-ranks itself, so the worst device is always the top row.

02

Detect

Behavioural detections land in the stream with tactic and confidence attached — 180 this week, 125 blocked or contained without waiting for a person.

03

Approve

The agent investigates and proposes: isolate diego-win-desk, run a full disk scan. Four proposals sit in the approval queue until a human says yes.

04

Remediate

The patch lag board and the remediation simulator turn the exposure score into a sequence of fixes — 101 devices at 45-plus days, oldest first.

One record

The device is the same device
everywhere in the estate.

An exposure score means more when the asset record, the network path and the access grant behind it are the same record — not three exports joined in a spreadsheet.

All 132 applications

Limits

What Endpoint does not do yet.

Finding this out on the third call is worse for you than reading it here, and worse for us.

Start

Open it before you talk to anyone.

Pilot

Your fleet, your scores

  • Everything in Try
  • Sensor rollout plan
  • Exposure baseline workshop
  • Estate map
Talk to sales

Estate

Endpoint with the rest of it

  • Endpoint with Inventory IT, Network and SIEM
  • One identity, one bill
  • CEDX delivery
Book an estate map

Questions

Before you pilot Endpoint.

Is the software on this page real?

Yes. Every screenshot is a capture of the running build and you can open the same build at /app/endpoint. It runs on demo data — the Northline fleet is the sample.

What goes into an exposure score?

The scoring model is its own tab on the Exposure screen, and every row names its top signal — an unpatched critical CVE, patch lag in days, behaviour. The score is a number you can argue with, not a colour you cannot.

Does the agent act on its own?

It investigates and proposes; a human approves. This week it investigated 39 detections, proposed 5 actions, and 4 were still pending approval. The two overrides are counted on the same card.

How are detections triaged?

Each detection carries severity, tactic, status and the agent's verdict with a confidence figure — benign 55%, suspicious 78%, malicious 82%. False positives are marked as such in the table, not silently dropped.

Is Endpoint audited or certified?

No certification has been issued. What we can evidence about hosting, encryption, tenant isolation and production access is written up on the security page.

The fleet is scored. Go and look at it.

Live build, demo data, no card. Then ask what your own top-of-queue device would be.