CEDX Monitoring · IT & Security

The alert arrives
with the cause attached.

CEDX Monitoring watches 48 services, 320 probes and every error budget — and instead of paging you with a symptom, it hands you the cause, the blast, and the next action, scored.

Checkout p99 is burning 14 times its budget rate. The alert says why — a dual-write path lagging since Monday's deploy — and the next action is scored 94: cut dual-write traffic to 20%.

monitoring.cedxsystems.com — live build
CEDX Monitoring overview: estate availability, open incidents, alerts firing, checks down, budget at risk and noise score.

Runs on demo data — Northline Production is the software's sample tenant, not a customer.

99.91% estate availabilityblended SLO, up 0.03 points this week
17 open incidents, 17 investigatedthe agent's coverage is printed on the ring
64 alerts flagged noisynoise score ≥80 — mute candidates, named

What it is

Monitoring that ends the meeting, not starts it.

48 services, each with a budget

The service catalog carries tier, status, RPS, p99 and error rate per row — ledger-api at 7.9K requests a second with p99 119 and 3.1% errors is critical; the 10 services with no SLO are listed as a coverage gap, not quietly unwatched.

  • Tier, RPS, p99, error rate and 7-day trend per row
  • No-SLO services counted on the card: 10
  • Ask which services burn fastest, from the screen
monitoring — screen-2
48 services, each with a budget

320 probes, including the browser ones

Checks are typed — HTTP, TCP, DNS, SSL, browser — with latency, uptime and failures per probe. The checkout browser probe takes 1,504ms at 97.3% uptime; the edge TLS expiry probe is up at 100.0%.

  • 20 down, 32 degraded, 14 on the critical path
  • Latency and uptime per probe, not per average
  • Muted probes are a state, not a deletion
monitoring — screen-3
320 probes, including the browser ones

A noise score for every alert

320 alert conditions, 39 firing, 64 with a noise score over 80. The table shows fires, pages and noise per alert — an idempotency alert at 116 fires and 19 pages with noise 99 is a mute conversation with evidence.

  • Fires and pages counted per alert
  • States: alerting, OK, no data, muted
  • 42 active mutes, visible on the card
monitoring — screen-4
A noise score for every alert

Product tour

Four screens, captured from the running build.

Not a mockup and not a concept deck. This is what opens at /app/monitoring.

monitoring.cedxsystems.com
CEDX Monitoring Overview screen.CEDX Monitoring Services screen.CEDX Monitoring Checks screen.CEDX Monitoring Alerts screen.

01 — Overview

The estate, with the causes attached

17 open incidents, 39 alerts firing, 20 checks down, 16 SLOs with under 40% of budget left. The root-caused panel does the handover: payments SEV-2 still mitigating — a missing circuit breaker on one card network — and the partner 429 storm traced to a batch job without jitter.

  • Golden signals weekly, with deploy markers
  • Slowest p99 per service with its error rate
  • Do-this-next actions, scored 94 and 91

02 — Services

The catalog is the contract

Sort by error rate and the argument ends: which service burns fastest this week is a sortable column, and the 6 critical-status services sit at the top with their p99 and 7-day trend.

  • 48 services: 6 critical, 19 degraded
  • Healthy, degraded, critical as chips
  • CSV export of the catalog view

03 — Checks

Probe the paths users actually take

Search checks by service or target; the critical-path card counts 14 probes down or degraded. Every probe shows what it is — SSL expiry, DNS, a full browser run — with its own latency and uptime.

  • 320 probes, 268 up
  • Browser checks with real duration, 1,504ms
  • Fails counted per probe, zero tolerance shown

04 — Alerts

Tune the noise, keep the signal

The ask bar suggests the questions: which alerts page the most, which noisy alerts we can mute, which criticals saw no pages this week. The table answers them with fires, pages and noise score per row.

  • Noisy ≥80 as its own card: 64 alerts
  • Muted 42, with mute debt tracked on the ring
  • Flapping alerts on critical paths, askable

Who runs it

Three roles keep the signal honest.

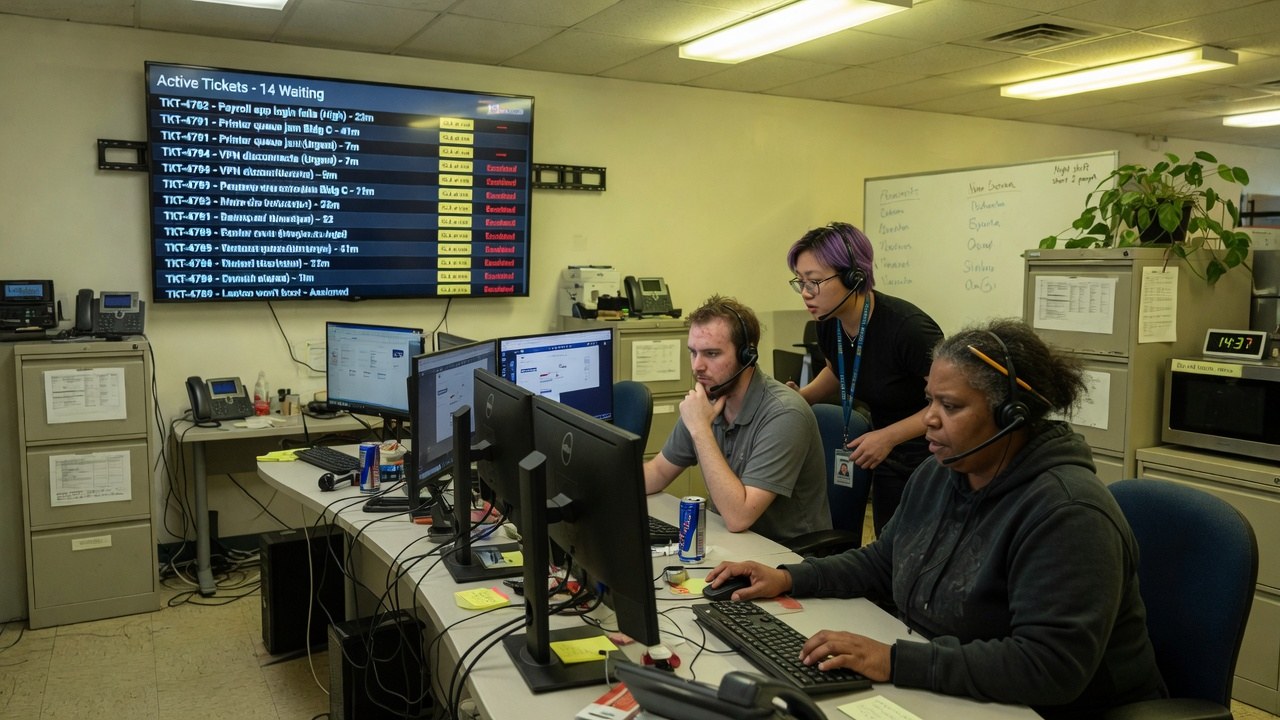
Roles, not references. We have no named customers yet, so nobody in these photographs is quoted, credited or claimed as one.

On-call engineer

Gets paged with the cause attached, works the scored next actions, and owns the incidents the agent has already investigated.

open incidents · 17

Service owner

Owns a row in the catalog: the SLO, the budget burn, the probes on the critical path — and the 10-service no-SLO gap if their service is in it.

no SLO · 10

Alert gardener

Prunes the 64 noisy alerts, reviews the 42 active mutes, and keeps mute debt from becoming blindness.

noise ≥80 · 64

The shape of it

What the demo estate actually looks like.

Every figure below is legible in the captures above. Nothing here is a projection of your estate — it is the state of the demo data.

99.91%estate availabilityblended SLO across 48 services
39alerts firingof 320 conditions
20checks downof 320 probes · 14 critical path
16SLOs under 40% budgetthe budget-at-risk card, this week
Slowest p99 by servicewith error rate, from the Overview
  • wms-sync — 1.1% errors890ms
  • search-worker — 1.0% errors695ms
  • orders-api — 0.0% errors649ms
  • payments-settle — 2.2% errors, SEV-2 open640ms
  • graphql-stream — 0.5% errors537ms
Alert severity mix41 medium of 100 firing and recent
  • Medium · 41 — the working bulk
  • Critical 8 · high 19 — paged first
  • Low · 32
Estate health91 on the Overview ring, inputs listed beside it
91
  • Health 91 · 17 of 17 open incidents investigated
  • Mute debt 18 · noise P95 68 — the drag on the score

How it runs

An incident's life, in the order it actually happens.

01

Probe

320 checks watch the paths that matter — SSL expiry to full browser runs — with latency and uptime per probe.

02

Detect

Signals fire against SLOs and error budgets; the golden-signals chart carries deploy markers so cause and effect share a timeline.

03

Investigate

The agent works every open incident — 17 of 17 — and the alert lands root-caused: symptom, cause, and the deploy it started with.

04

Act

Next actions arrive scored: cut dual-write traffic to 20% at 94, silence the cache-flap cluster at 91, ship the circuit breaker to close the SEV-2.

One record

The signal becomes
the incident, the ticket, the fix.

A firing alert is the start of work, not the end of it — and the work lives in the same estate that watches the signal.

All 132 applications

Limits

What Monitoring does not do yet.

Finding this out on the third call is worse for you than reading it here, and worse for us.

Start

Open it before you talk to anyone.

Pilot

Your services, your SLOs

  • Everything in Try
  • Service catalog import
  • SLO design workshop
  • Estate map
Talk to sales

Estate

Monitoring with the rest of it

  • Monitoring with ITSM, Network and SIEM
  • One identity, one bill
  • CEDX delivery
Book an estate map

Questions

Before you pilot Monitoring.

Is the software on this page real?

Yes. Every screenshot is a capture of the running build and you can open the same build at /app/monitoring. It runs on demo data — Northline Production is the sample.

What does “root-caused” mean here?

The alert names the symptom, the cause and the fix: checkout p99 burning 14× is traced to the dual-write path lagging since Monday's deploy, and the next action — cut dual-write traffic to 20% — is scored 94. You can argue with all three on the screen.

How does it handle alert noise?

Noise is a score per alert, with fires and pages counted. 64 alerts sit above 80 and are named as mute candidates; 42 mutes are active, and mute debt is tracked on the health ring so quiet does not become blind.

What are the checks?

Typed probes — HTTP, TCP, DNS, SSL and full browser runs — 320 of them, each with latency, uptime and failure counts. Fourteen sit on the critical path and get their own card.

Is Monitoring audited or certified?

No certification has been issued. What we can evidence about hosting, encryption, tenant isolation and retention is written up on the security page.

The signals are firing. Go and look at them.

Live build, demo data, no card. Then ask which of your alerts would survive a noise score.