Voice scores the things contact centres usually argue about: clarity per leg, drop risk per live call, who ended the media, and which queues are understaffed, as columns on the floor, not as a weekly report.
The hangup-side panel is the honest one: the network ended 81 calls in the window; callers ended 47. When your own infrastructure tops the blame chart, the chart is probably telling the truth.
voice.cedxsystems.com: live build
Runs on demo data. The phone numbers in the captures are demo lines, not real ones.
81.9% connect rateanswered ÷ offered, last 30 days
86 calls at high drop riskrisk ≥55, live and recent, listed by call id
13.1% abandon + failof 320 calls in the sample window
What it is
Three screens that read the floor.
88 calls in motion, each with a risk score
The live floor shows every call by state (32 talking, 16 ringing, 22 on hold) with age, risk and talk percentage. CL-1042 has been talking 4:22 at risk 100 with the agent at 78% talk time; the monologue alert named it before any supervisor would.
Ringing, talking, hold and wrap as states
Talk % per call: the monologue tell
Wait age bucketed <30s to >2m
voice screen-2
Every call leaves a record
Direction, status, queue, agent, duration, clarity and risk on every row. CL-1033 failed on Technical at 34 seconds with clarity 2.1, a network event you can diagnose, not a complaint you cannot. AI receptionists appear in the agent column, labelled as AI.
Clarity score per leg, 3.9 average
Dropped 42 and high-risk 86 as tabs
Inbound and outbound filters
voice screen-3
24 queues, 13 understaffed
Depth, ASA, goal, abandon rate, staff actual-versus-needed and risk average per queue. Field support runs ASA 41s against a 20s goal; Partner desk abandons 8.3% at five-of-seven staffed.
ASA next to goal, per queue
Abandon 8.3% worst on the partner desk
An understaffed-only toggle
voice screen-4
Product tour
Four screens, captured from the running build.
Not a mockup and not a concept deck. This is what opens at /app/voice.
voice.cedxsystems.com
01 Overview
The month, with causes attached
Offered-versus-answered across 30 days with events as markers: a new VIP number live on Jul 12, an AI receptionist version on Jul 21, a promo-week spike on Jul 30, the clarity floor raised to 3.5 on Aug 2. The hangup-side panel says who ended the media: network 81, system 58, caller 47, agent 47.
Floor health 80: live 88 · risk 86 · connect 81.9%
Packet-loss cluster named to a specific number
AHT 3:55 on completed calls only, stated
02 Live floor
Every call, while it is still a call
Eighty-eight live calls with state, queue, agent, age, risk and talk percentage. The wrap column lists who is in after-call work, and the wait-age bars split ringing plus hold into under-30s through over-2m.
32 talking · 16 ringing · 22 on hold
Wrap list with agent per call
Risk 100 rows are live, not historical
03 Calls
The log, with clarity on every row
Three hundred twenty calls with caller, direction, status, queue, agent, duration, clarity and risk. The failed rows say why in the columns (21 seconds, clarity 4.3, an AI agent), so triage starts from the row itself.
88 live · 42 dropped · 86 high risk as tabs
Search by caller, company, agent or id
AI receptionists labelled in the agent column
04 Queues
Staffing against the promise
Twenty-four queues with depth, ASA, goal, abandon, staff and average risk. Eight queues are over their ASA goal right now, 127 callers are waiting in total, and the understaffed toggle reduces the board to the 13 that need people.
127 waiting across 24 queues
8 over ASA goal · 13 understaffed
Risk average per queue, not per month
Who runs it
Three roles keep the floor honest.
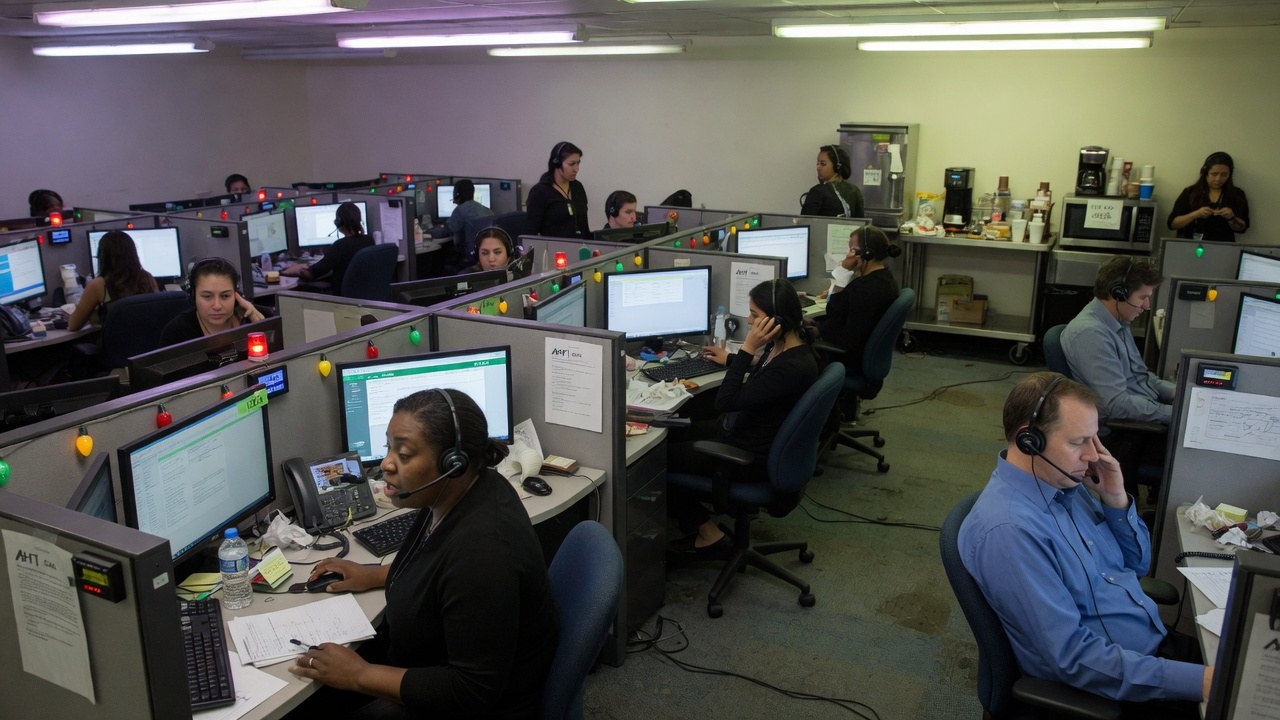
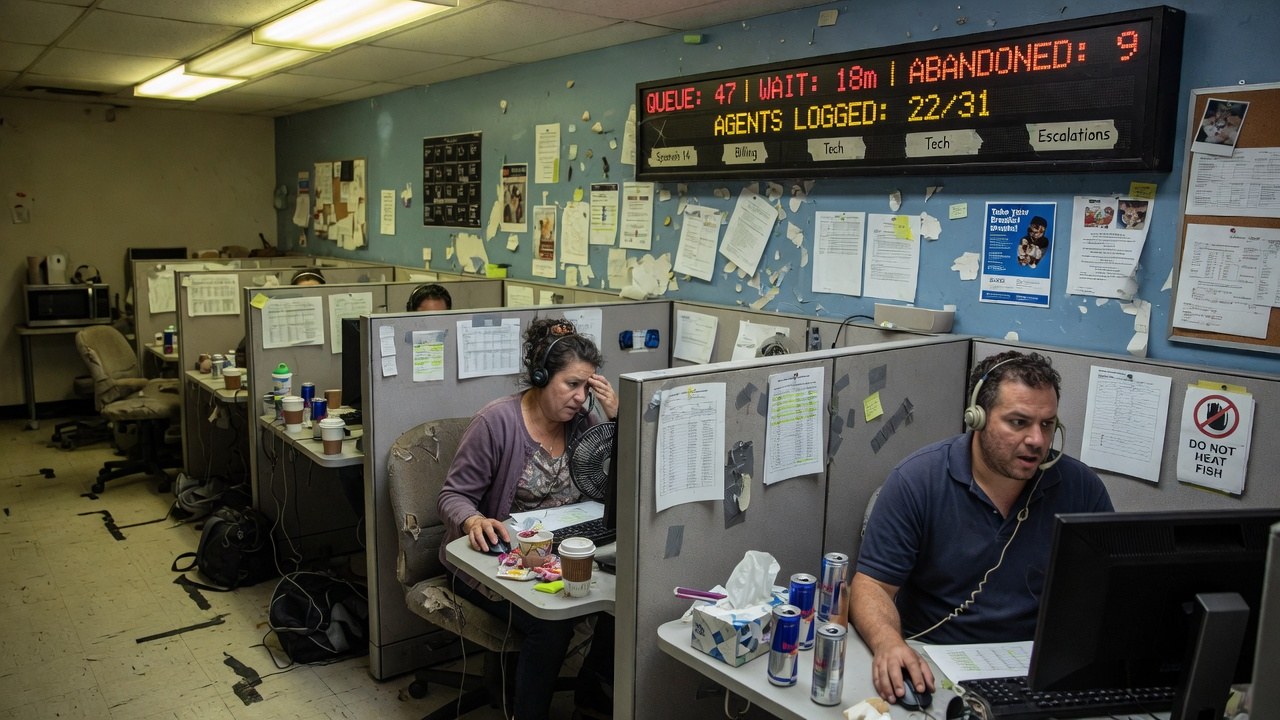
Roles, not references. We have no named customers yet, so nobody in these photographs is quoted, credited or claimed as one.
Duty manager
Owns the floor health number, 80 today, and makes the staffing call when a queue's ASA passes its goal. The queue board in the photograph is the same job, older technology.
understaffed · 13 of 24
Telephony and numbers
Runs the numbers and the IVR flows. The menu-3 drop step and the packet-loss cluster on one line are theirs to fix.
menu-3 drop · 8.2%
QA and coaching
Works the high-risk list. A 78% agent monologue on a VIP call becomes a coaching note, not a blame.
high risk · 86
The shape of it
What the demo workspace actually looks like.
Every figure below is legible in the captures above. Nothing here is a projection of your estate. It is the state of the demo data.
320calls in the sample window88 live right now
3:55average handle timecompleted calls only, +10s
3.9average clarity per scored legfloor raised to 3.5 on Aug 2
42dropped or failedabandon + network, 13.1% of calls
Who ended the mediahangup side · the network tops the chart
Network81
System58
Caller47
Agent47
Connect rate, 30 daysanswered ÷ offered
Answered · 81.9%
Abandon + fail · 13.1%
Queue staffing13 of 24 queues understaffed
13/24
Understaffed · 13
Staffed to need · 11
How it runs
A call's life, in the order it actually happens.
01
Offer
Calls offer to queues through the IVR. The menu-3 step drops 8.2% of support calls before a queue, and the alert names the menu.
02
Connect
81.9% connect; the rest abandon or fail and stay counted, 42 rows in the dropped tab with causes in the columns.
03
Score
Clarity is scored per leg, 3.9 on average, so “the line was bad” is a number with a floor, not a mood.
04
Review
Eighty-six high-risk calls hold a live list; one VIP call's 78% agent talk time became the monologue alert a coach now owns.
One record
The call is one channel of one record.
Voice shares its demo estate with the queue, the chat floor and the remote toolbox: same workspace, same Ask AI button.
Finding this out on the third call is worse for you than reading it here, and worse for us.
Voice is not generally available. What opens today is the live build on demo data. The Northline Contact Centre is the software's demo tenant, not a customer.
The phone numbers in the captures are demo lines. Callers, companies and agents in the rows are the demo seed's, not customers.
Clarity and drop-risk scores come from the demo model. Thresholds like the 3.5 clarity floor are configuration, not an industry standard.
The AI receptionists on the floor are demo configuration. We do not claim containment or call-quality figures for your telephony here.
Recording retention is your policy to set, and no call-recording compliance certification has been issued. What we can evidence about hosting is on the security page.
Yes. Every screenshot is a capture of the running build, open at /app/voice. It runs on demo data. The contact centre on the chrome is the demo tenant.
What is the clarity score?
A per-leg quality score, 3.9 on average across the demo window. The floor was raised to 3.5 on Aug 2, visible as a marker on the overview chart, and the packet-loss cluster alert names the number it affected.
How is drop risk computed?
Live and recent calls get a risk score; 86 sit at ≥55 and the worst read 100 on the live floor. The signals show up in the alerts: monologue risk from talk-time splits, network clusters from packet loss.
Are the AI agents real?
They are labelled in the agent column. Billing, auth and a Spanish receptionist handle demo calls. They are demo configuration, shown because the floor shows them; we do not quote their containment as a figure for your centre.
Is Voice audited or certified?
No certification has been issued. What we can evidence about hosting, encryption and access is on the security page.
The floor is live. Listen to it.
Live build, demo data, no card. Then ask who ended your last hundred calls.