Services runs the delivery book end to end: 320 engagements, 48 SOWs with hours remaining, and the margin on every row, 53% portfolio margin against a 34% target, with the 17 at-risk engagements named and priced.
The alert worth reading is the polite one: “Billable util 124% vs 75% target: above target, protect quality.” A services tool that only cheers is not watching the same business you are.
services.cedxsystems.com, live build
Runs on demo data. Dollar figures are the seeded demo portfolio's, not billing data.
320 engagements on the book193 active in delivery and closing
$62.9M booked revenue$41.7M billed to date across the signed portfolio
17 engagements at margin riskscore ≥55 · $342K of portfolio dollars at risk
What it is
Three numbers a services business lives or dies on.
The SOW is a budget with hours left
Forty-eight statements of work with type, status, value, hours and hours remaining on every row: 36 signed live, 39,105 hours left across the view. A fixed-price SOW at 2,400 hours with 850 left is a different conversation at week 31 than at week 39.
$13.4M across the 48 SOWs in view
Statuses: Active · Draft · Expired · Closed
T&M, Fixed and Retainer as first-class types
services: screen-3
Margin on the row, not in the quarter deck
Every engagement carries budget, billed and margin; the average across the view is 42%. The type and status chips cut the book the way partners actually ask about it: Fixed-price closing work, retainers on hold, T&M in active delivery.
320 rows · $73.8M in the matching view
Budget vs billed on every engagement
PM named on each row
services: screen-2
The task ledger ties hours to the engagement
320 tasks across the engagements (296 open, 7,544 estimated hours), each with its engagement key, status, estimated versus actual hours and a billable Yes/No flag. Non-billable knowledge transfer is visible as non-billable, not absorbed.
89 tasks at risk or blocked, chip-filtered
Est vs actual on every row: 43 estimated, 33 actual
211 billable-open tasks of 296 open
services: screen-4
Product tour
Four screens, captured from the running build.
Not a mockup and not a concept deck. This is what opens at /app/services.
services.cedxsystems.com
01 Overview
The book, with its health score
193 active engagements, utilisation 124% against a 75% target, margin 53% against 34%, and $461K of time sitting unapproved. Portfolio health reads 20% and the alerts say why: one engagement at margin 15% with burn 92%, 160 entries pending approval, and utilisation high enough to be a quality risk.
Booked vs billed, weekly $K, W25 to W36
By status: 60 pipeline · 89 active · 48 on hold · 56 closing · 67 closed
121 engagements flagged health-critical
02 Engagements
320 rows of the delivery book
The ledger: key, engagement, client, type, status, budget, billed, margin, PM. Cut it by T&M, Fixed or Retainer; by Active, Pipeline, Closing or On Hold. The counts and the dollars follow the filter.
Avg margin across the view: 42%
Active portfolio: 193 in delivery and closing
Search across key, name and client
03 SOWs
Commercial state, hours remaining
Forty-eight SOWs sorted by value with hours and hours left on each: the largest at $680K has 850 of 2,400 hours remaining; a draft sits unsigned at full hours. The book's 39,105 remaining hours are the delivery organisation's real backlog.
36 active SOWs, signed live
Draft and Expired as visible states
CSV export of the commercial view
04 Tasks
Where the hours actually go
Every engagement decomposes into tasks with estimates, actuals and a billable flag. The blocked chip isolates the 89 that need attention; the billable chip shows the 211 that earn. The margin board upstream is built from these rows, not from a monthly estimate.
7,544 estimated hours across 320 tasks
Chips: Todo · In Progress · Blocked · Review · Done · Billable · Risk
Owner and engagement key on every row
Who runs it
Three roles run the book.
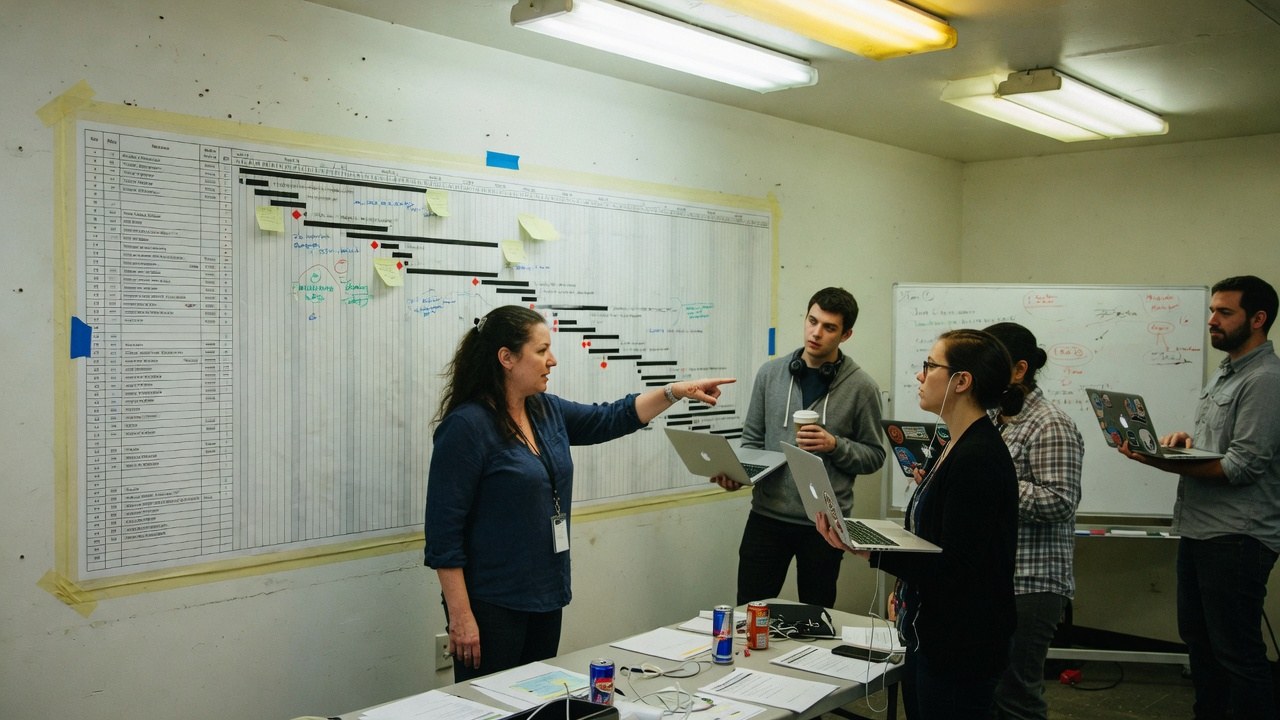
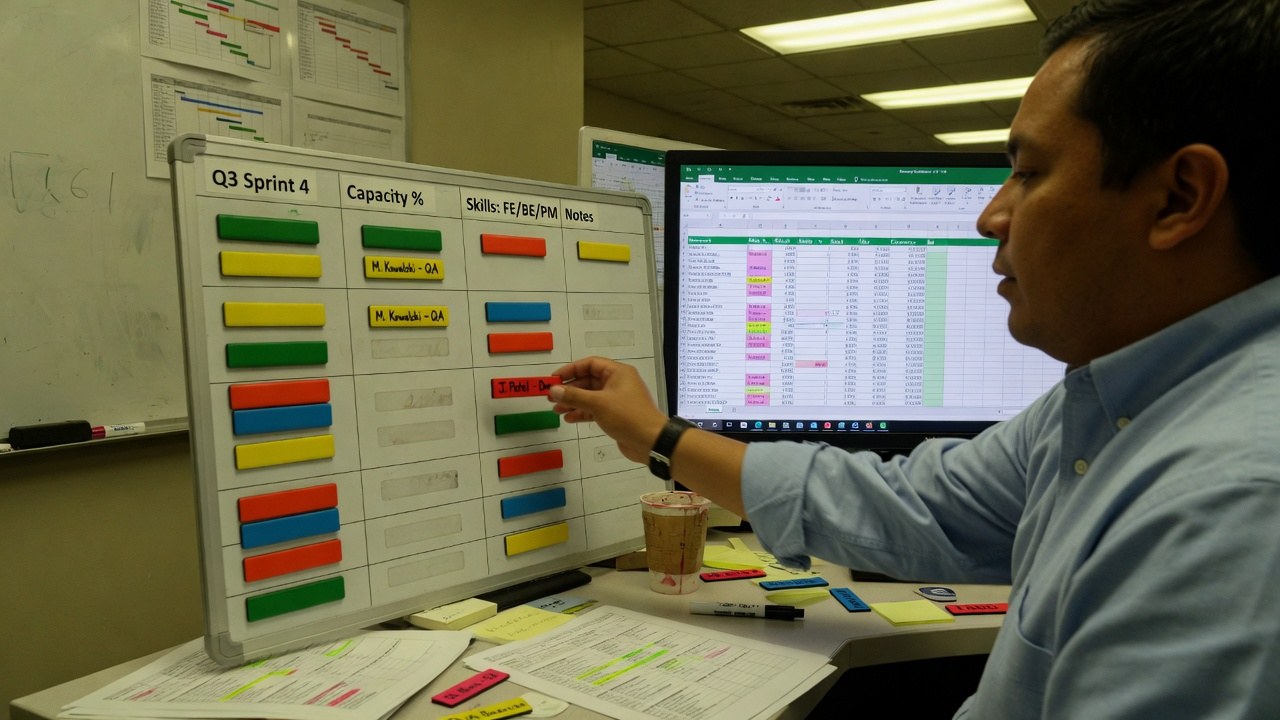
Roles, not references. We have no named customers yet, so nobody in these photographs is quoted, credited or claimed as one.
Engagement manager
Owns the row: budget, billed, margin and the tasks underneath. A 95% margin-risk score with burn at 92% is their Monday, not their quarter-end.
margin risk · 17 engagements
Resource planner
Staffs the SOWs against the roster: 39,105 hours remaining is demand, and the delivery bench either covers it or it does not.
hours remaining · 39,105
Consultant
Logs against the task, sees the billable flag on the row, and knows which of their hours the client pays for, because the ledger says so.
billable open · 211 tasks
The shape of it
What the demo book actually looks like.
Every figure below is legible in the captures above. Nothing here is a projection of your estate. It is the state of the demo data.
Finding this out on the third call is worse for you than reading it here, and worse for us.
Services is not generally available. What opens today is the live build on demo data. The engagements, clients, SOWs and every dollar figure in the captures are the seeded demo portfolio.
We have no named customers to show you, so this page shows none. The client names on the engagement rows are demo fixtures, not references.
Margin, utilisation and health scores are computed on the demo data's rates and costs. They illustrate the mechanic; they are not readings of your book.
Revenue-recognition treatment of fixed-price work is not modelled here. Booked, billed and hours are shown, and anything beyond that is a conversation, not a claim on this page.
No audit or compliance certification has been issued for Services. What we can evidence about hosting, encryption and access is on the security page.
Yes. Every screenshot is a capture of the running build and you can open the same build at /app/services. It runs on demo data.
Where does the margin figure come from?
From the rows underneath: budget versus billed per engagement, built up from tasks carrying estimated and actual hours with a billable flag. The portfolio reads 53% against a 34% target; the view average is 42%; both are printed where you can check them.
Why is 124% utilisation flagged as a problem?
Because the target is 75% and the alert says so plainly: “above target, protect quality.” Sustained over-utilisation is how services businesses burn their delivery teams, and the product treats it as a risk, not a win.
What is unapproved time?
Logged hours no manager has approved yet: $461K across 160 entries in the demo. Unbilled work you cannot invoice is a cash problem, so it sits on the overview as a card, not in a report.
Can I see which engagements are actually in trouble?
Yes. The margin board scores them: 17 at risk (score ≥55) with $342K of portfolio dollars at stake, and the top row spells out why: margin 15%, burn 92%, $65K at risk on one engagement.
Is Services audited or certified?
No certification has been issued. What we can evidence about hosting, encryption, tenant isolation and production access is written up on the security page.
The book is open. Read it the way partners do.
Live build, demo data, no card. Then check what your own unapproved-time number would be.