Onboarding runs new customer accounts as a managed queue: each one carries a stage from kickoff to go-live, a health score, a predicted time-to-value and a named owner. The tasks that slip are counted in days late, not vibes.
The overview does not hide its worst number. Median predicted time-to-value is 61 days against a 42-day target, and the card is flagged watch. A product that shows you that on page one is showing you everything.
onboarding.cedxsystems.com, live build
Runs on demo data. The workspace names itself Customer Onboarding · Northline Launch Q3 2026.
261 active accountsof a 320-account portfolio · average health 59
61d median predicted time-to-valueagainst a 42-day target · flagged watch
48 playbooks in the library1,244 accounts attached to the 42 active plays
What it is
Accounts, playbooks, and the tasks that slip.
Every account carries stage, health and a go-live date
Three hundred twenty accounts with segment, stage, health, predicted time-to-value, blocker count, go-live date and owner on every row. Stage chips run Kickoff, Setup, Training, Integration, Pilot, Go-live, and Adopted for the ones that made it.
Health 0 to 100 and predicted TTV per account
Segments: Enterprise · Mid-market · Growth
140 at risk across health, blockers and TTV
onboarding screen-2
Playbooks with completion rates, not good intentions
Forty-eight plays with steps, average days, completion percentage and accounts attached per row. A Growth Starter 30-day play runs 18 steps in 28 days at 84% completion across 62 accounts; the Enterprise Platform Fast Path holds 91% across 50.
18 to 54 steps per play, average days beside it
Completion from 40% to 91% across the library
Active · Draft · Archived states
onboarding screen-3
The task queue counts days late
Four hundred twenty tasks (313 open, 94 overdue) with type, priority, due date and days late on every row. The top of the queue is a playbook swap 25 days late at P0, next to a security questionnaire close 20 days late. This is where launches actually slip.
94 overdue · 109 due today · 110 upcoming
Types: Call · Email · Workshop · Config · Training
Priority P0 to P2 with owner per task
onboarding screen-4
Product tour
Four screens, captured from the running build.
Not a mockup and not a concept deck. This is what opens at /app/onboarding.
onboarding.cedxsystems.com
01 Overview
The launch brief, worst number first
Active accounts 261, value target 62% attained, median predicted TTV 61 days against the 42-day target, 140 at risk and 94 overdue tasks. Root-caused alerts price the rest: a playbook mismatch at $168K, a compliance-gate hold at $132K.
Value QTD 53 of 86 activations
Active by stage: 41 · 30 · 55 · 47 · 39 · 49
Agent watch labelled “scripted agent feed” on screen
02 Accounts
The portfolio as a working list
Search across 320 accounts by playbook or product. Health, predicted TTV, blockers and go-live date sit on the row, so an account at health 95 with a 78-day predicted TTV is visible before its renewal is.
320 accounts · 261 active
Average health 59 across actives
CSV of the filtered portfolio
03 Playbooks
The library the queue runs on
Forty-eight plays by segment and product (Starter, Payments, Platform, WMS, Analytics), each with steps, average days and completion. Migration plays sit next to fast paths, and the completion spread from 40% to 91% is the argument for fixing one playbook at a time.
1,244 accounts attached to active plays
Average completion 65% across the library
Filter by segment: Enterprise · Mid-market · Growth
04 Tasks
Where go-lives are won or lost
The queue behind every stage: SSO configuration, environment setup, cutover rehearsal, pilot success criteria, champion check-ins. Each task shows type, status, priority, due date and exactly how many days late it is.
420 tasks · 313 open
Overdue flagged watch at 94
64 go-lives inside 30 days on the overview card
Who runs it
Three roles carry a launch.
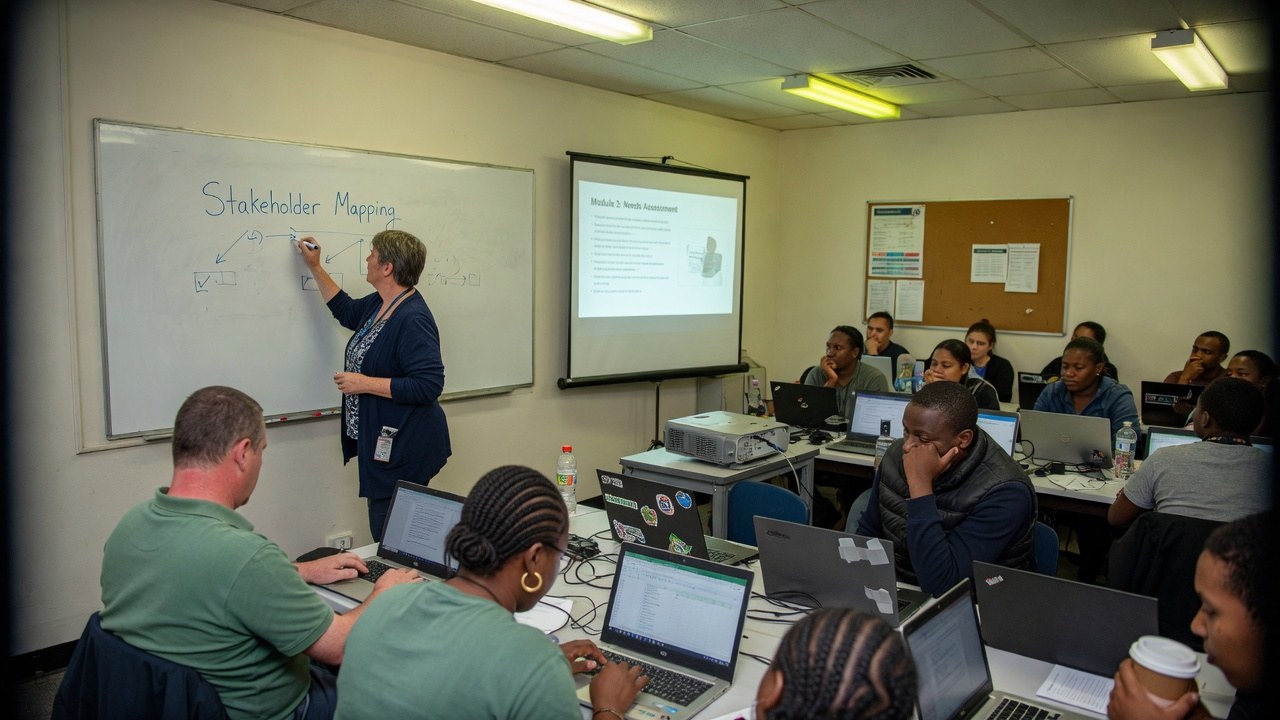
Roles, not references. We have no named customers yet, so nobody in these photographs is quoted, credited or claimed as one.
Implementation lead
Owns the playbook: 18 to 54 steps, and the completion percentage that says whether the play itself is the problem.
48 plays · 65% avg completion
Customer success manager
Works the at-risk list (140 accounts) and the champion check-ins before a quiet sponsor becomes a lost launch.
140 at risk · health to 26
Solutions engineer
Lives in the config queue: SSO, security questionnaires, environment setup, the P0 tasks counted in days late.
94 overdue · 25d worst
The shape of it
What the demo workspace actually looks like.
Every figure below is legible in the captures above. Nothing here is a projection of your book. It is the state of the demo data.
261active accounts320-account portfolio · health 59 avg
62%value target attained53 of 86 activations QTD
140accounts at riskhealth, blockers or predicted TTV
94overdue tasksof 420 · worst 25 days late
Active accounts by stage261 accounts · overview stage bars
Kickoff41
Setup30
Training55
Integration47
Pilot39
Go-live49
Highest predicted time-to-valuedays · with account health beside it
Health 34 account107d
Health 44 account103d
Health 48 account102d
Health 35 account99d
Health 32 account98d
Value target health86 activations QTD · 53 landed
62%
Value QTD 53 of 86
Avg predicted TTV 61d vs 42d target
How it runs
A launch, in the order it actually happens.
01
Kickoff
An account enters with a segment and a playbook attached (41 accounts sit at kickoff in the current view) and the clock on predicted TTV starts.
02
Configure
SSO, environments and security questionnaires land in the task queue with owners and due dates; 94 of them are late right now, counted in days.
03
Prove value
Pilot success criteria and training move the account through integration and pilot while the predictor re-scores its time-to-value.
04
Go-live
Cutover rehearsals precede the window (64 go-lives are inside 30 days) and readiness is a percentage, not a hope.
One record
The account onboarded is the account the estate runs.
Onboarding is the first ninety days of the same record the rest of the estate serves after go-live.
Finding this out on the third call is worse for you than reading it here, and worse for us.
Onboarding is not generally available. What opens today is the live build on demo data: the accounts in the captures are synthetic, not customers.
This build onboards customer accounts. If you came looking for employee onboarding, that flow runs through Recruiting, People and Learning in this estate. The captures here are unambiguous about which one this is.
Predicted time-to-value is a demo model over seeded accounts. We are not claiming a validated prediction for your book.
The agent watch panel is labelled “scripted agent feed: demo observations from seeded signals” on screen. It is not a live AI feature.
We have no named customers to show you, so this page shows none. The demo account names in the captures are not references either.
No audit or compliance certification has been issued for Onboarding. What we can evidence about hosting and access is on the security page.
Yes. Every screenshot is a capture of the running build and you can open the same build at /app/onboarding. It runs on demo data, which the workspace labels on screen.
Is this employee onboarding?
No, and we would rather say so here than on a call. The captures show customer onboarding: accounts, playbooks, go-lives. Employee onboarding in this estate runs through Recruiting, People and Learning.
How is predicted time-to-value computed?
By a demo model over seeded account data: stage, blockers, task lateness. The 61-day median against a 42-day target is the demo portfolio's figure, shown because it is legible in the capture.
What does “at risk” mean here?
Three signals, on screen: low health, open blockers, or a predicted TTV running long. One hundred forty accounts in the demo portfolio trip at least one.
Is Onboarding audited or certified?
No certification has been issued. What we can evidence about hosting, encryption, tenant isolation and production access is written up on the security page.
The queue is running. Go and look at it.
Live build, demo data, no card. Then find the task that is quietly 25 days late in your own launches.