320 loads across TL, LTL, intermodal and parcel: 237 active, 39 exceptions, 126 slipping two hours or more. Empty miles priced at $21K, detention at $16K, and a scorecard that attributes $84K of detention to 24 carriers by name.
FR-8812 is invoiced at $2,688 against a $2,320 tariff, a 20.5% dispute flagged on the invoice line, not found in a quarterly audit. That is what the freight record is for.
logistics.cedxsystems.com, live build
Runs on demo data. The Chicago hub is the software's demo network, August 2026.
237 active loads of 32039 exceptions · 126 slipping ≥ 2h
76.6% on-timethe network-health ring reads 77
$21K empty-mile waste11,455 empty miles · 10% deadhead avg
What it is
Three tables the network runs on.
Every load, with slip and rate on the row
LD-10092 runs CHI to DFW on a TL at 371 miles, slipping 12 hours at $495, with the track age next to the slip. Mode, carrier, miles, slip, track and rate: the whole argument is one table wide.
Modes: TL, LTL, intermodal, parcel
Slip hours and track age per row
Rates from $495 to $3.7K in view
logistics: screen-2
48 lanes, with deadhead measured
RT-ATL-NWK runs 26% empty against a 10% network average, and the empty ≥ 18% filter isolates the lanes like it. Plan miles against actual miles is on every row: 860 planned, 910 actual on that lane.
Empty % and on-time % per lane
Plan miles vs actual miles
Stops counted per route
logistics: screen-3
24 carriers on a scorecard
Acceptance, on-time, loads, detention dollars and score per carrier. Lumen Fleet scores 98; Apex Freight runs 94% on-time while carrying $15K of detention; the weakest TL carrier in view scores 68 with $19K attributed.
Acceptance and on-time per carrier
Detention attributed, $0 to $19K
Preferred carriers starred in the list
logistics: screen-4
Product tour
Four screens, captured from the running build.
Not a mockup and not a concept deck. This is what opens at /app/logistics.
logistics.cedxsystems.com
01 Overview
The network brief, with the exposure priced
Active loads 237, on-time 76.6%, detention risk 156 loads with free time low at $16K, empty-mile waste $21K, freight spend $218K, late ETA 126. The alerts do the arithmetic: LD-10482 has 0.4 hours of free time left after a 3.8-hour dwell at dock 3.
Network health 77, broken into four inputs
Highest ETA slip: LD-10092 at 12 hours
Load status: 56 tendered through 39 exception
02 Loads
The board dispatch actually works
320 loads with lane, mode, status, carrier, miles, slip, track and rate. The exception chip counts 39; the slip ≥ 2h count is 126. Sorted by slip, the worst is 12 hours and it says which carrier.
39 exceptions needing a touch
126 loads slipping two hours or more
Tendered, In transit, Delivered, Exception chips
03 Routes
Where the empty miles live
48 tracked lanes with mode, stops, plan and actual miles, empty % and on-time %. The intermodal lane between the two coasts runs 2,100 planned against 2,180 actual at 24% empty. The deadhead is measurable, lane by lane.
10% average deadhead across the network
Empty ≥ 18% filter on the bar
85% average on-time across routes
04 Carriers
The scorecard meeting, already minuted
24 carriers with acceptance, on-time, load count, detention dollars and score. $84K of detention is attributed across the list, so the quarterly conversation starts from the same table.
Scores from 98 down to 68
Detention $ per carrier, not per quarter
Region and mode per carrier
Who runs it
Three roles keep the freight moving.
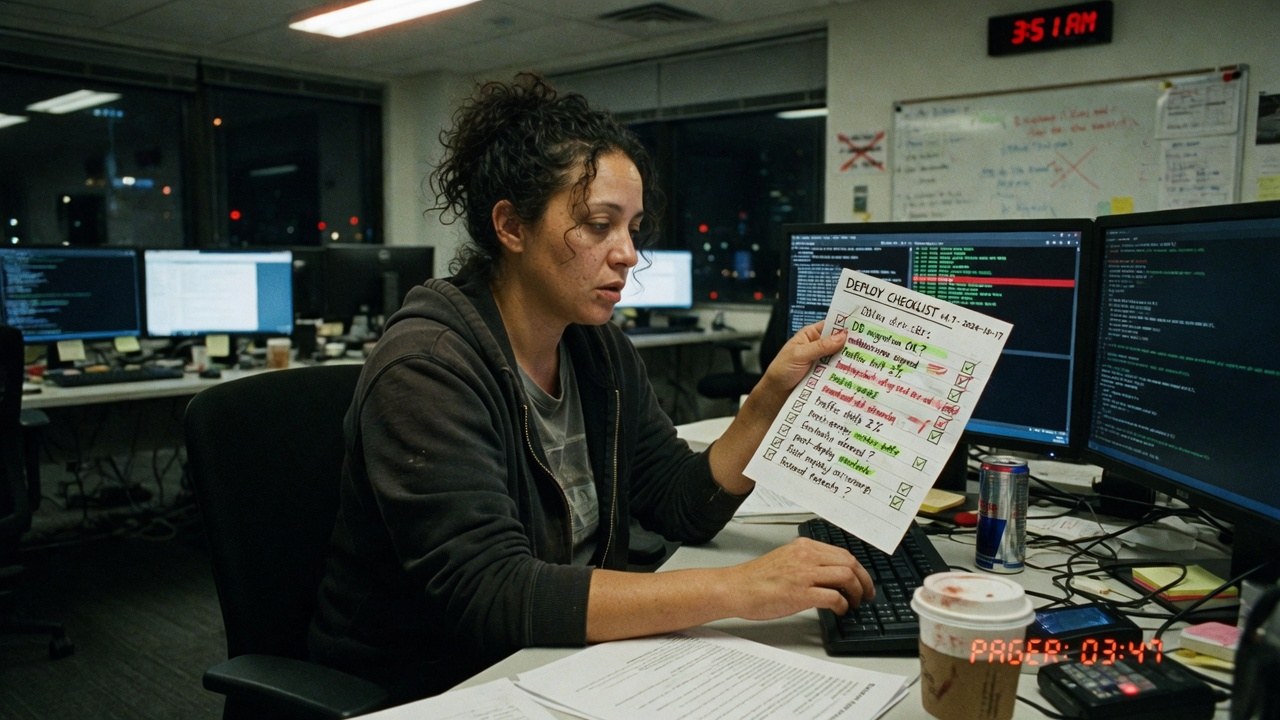
Roles, not references. We have no named customers yet, so nobody in these photographs is quoted, credited or claimed as one.
Night linehaul desk
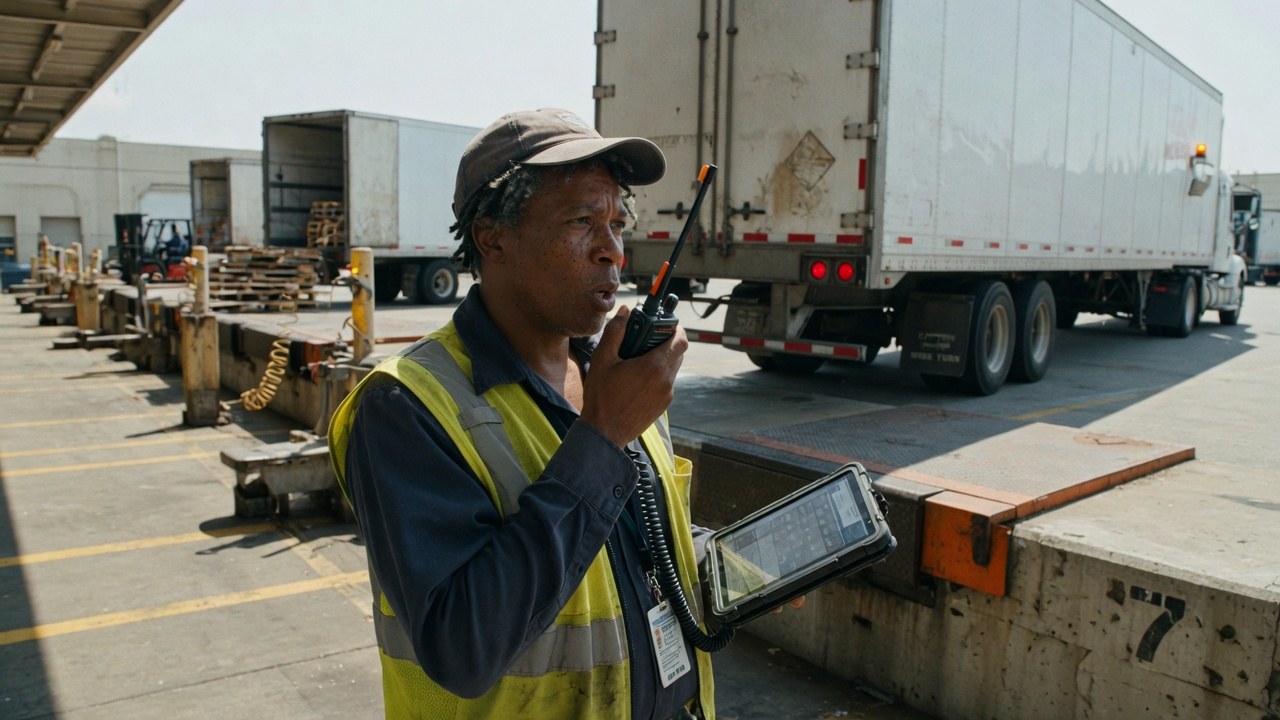
Owns the 126 slipping loads while the network sleeps. LD-10420's no-show dock burned the free time and stands at $2.1K of exposure before morning.
slipping ≥2h · 126
Dispatch
Works the exception queue: 39 loads need a touch, sorted by slip hours, the worst at 12. The track column says how stale the last update is.
exceptions · 39
Carrier and freight manager
The scorecard meeting writes itself: 24 carriers, $84K of detention attributed, and one dispute flagged at +20.5% on the invoice line.
detention · $84K
The shape of it
What the demo network actually looks like.
Every figure below is legible in the captures above. Nothing here is a projection of your network. It is the state of the demo data.
237active loadsof 320 · 39 exceptions
76.6%on-time126 loads slipping 2h or more
$21Kempty-mile waste11,455 empty miles
$84Kdetention attributed24 carriers scored
Root-caused alerts, priced on screensymptom → cause → fix · demo network
LD-10420 exception, no-show dock: slip 9h, free time exhausted$2.1K
LD-10482 detention risk: free time 0.4h left, dwell 3.8h at dock 3$1.2K
Empty-mile waste on the ATL drop: LD-10470 deadheading 180 miles$648
FR-8812 freight dispute: invoice $2,688 vs tariff $2,320, detention accessorial$468
Loads by status237 active of 320 in view
Active: tendered through in transit · 237
Delivered · 42
Exception · 39, the queue dispatch works
Network health77 on-time, the overview ring
77
On-time 76.6% across the network
The gap is the 126 loads slipping 2h+
How it runs
A load's life, in the order it actually happens.
01
Tender
A load enters with lane, mode and rate: 56 tendered in view, carriers accepting or not on the scorecard.
02
Track
The ETA board watches slip: 126 loads at two hours or more, LD-10092 the worst at 12.
03
Exception
Detention and no-shows price themselves. LD-10482 has 0.4 hours of free time left after a 3.8-hour dwell.
04
Settle
Freight lines reconcile against tariff: FR-8812 flagged at +20.5%, $2,688 against $2,320, on the invoice line.
One record
The dock is one record from both directions.
A load dwells at a dock the warehouse staffs, on a SKU the order book sold, hauled by a fleet the asset register meters. The demo estate keeps all four views.
Finding this out on the third call is worse for you than reading it here, and worse for us.
Logistics is not generally available. What opens today is the live build on demo data. The Chicago hub is the software's demo network, not a customer.
We have no named customers to show you, so this page shows none. The carriers on the scorecard are demo carriers, not references and not real companies.
The 76.6% on-time figure and the $84K detention total are the demo network's, computed from demo loads. They are not industry benchmarks.
The ETA board reports slip in hours; it does not claim to predict arrivals. 126 loads are late and the screen says how late, not why it will be fine.
The freight-audit flag marks a variance on a line: +20.5% on FR-8812. It is not a settled claim and this page does not promise recovery.
No audit or compliance certification has been issued. What we can evidence about hosting, encryption and access is on the security page.
Yes. Every screenshot is a capture of the running build, and you can open the same build at /app/logistics. It runs on demo data: the Chicago hub network.
What counts as detention risk?
Loads whose free time is nearly gone. 156 loads in the demo are flagged at $16K; LD-10482 is the worked example: 0.4 hours of free time left after dwelling 3.8 hours at dock 3, priced at $1.2K.
How is empty-mile waste computed?
Deadhead miles between a drop and the next live load, priced. The demo carries 11,455 empty miles at $21K, and the route table shows which lanes produce them: RT-ATL-NWK runs 26% empty.
What does the carrier score mean?
A rollup of what the table shows: acceptance, on-time, load count and detention dollars. Lumen Fleet scores 98; the weakest TL carrier in view scores 68 with $19K of detention attributed. The inputs are on the row, so the score is arguable from data, not from us.
Is the freight dispute a real audit feature?
It is a flag, honestly labelled: FR-8812's invoice of $2,688 against a $2,320 tariff is a +20.5% variance on a detention accessorial. What a person does with the flag is a process, and this page does not claim the software settles it.
Is Logistics audited or certified?
No certification has been issued. What we can evidence about hosting, encryption, tenant isolation and production access is on the security page.
The network board is running. Go and look at it.
Live build, demo data, no card. Then check how much free time your busiest dock has left.