Field scores the day before it happens: every job carries a first-time-fix risk, every route carries a load score and drive minutes, and every technician carries utilization and overtime risk as two different numbers.
The technicians table settles an argument every dispatch board has: one tech at 48% utilization carries an overtime risk of 91, because travel is 45% of his day. Busy and overloaded are not the same column.
field.cedxsystems.com, live build
Runs on demo data. Technicians, vans and sites in the captures are the demo region's rows.
78.6% first-time fixtrailing 60 days, +1.2 on the card
116 jobs at high FTF riskrisk ≥55, callbacks lead the list
4,234 drive-minutesacross 60 day routes in view
What it is
Three screens that run the day.
320 jobs, each with a fix-risk score
The jobs table carries type, priority, status, technician, FTF risk and SLA-left on every row. The top of the risk sort is instructive: the first fourteen rows are all callbacks, sitting at 95 to 99. Yesterday's fixes are today's riskiest work.
FTF risk and SLA-left on every row
Callback, repair and install as job types
Six states, scheduled through cancelled
field screen-2
60 routes with load scores and drive time
Routes show zone, stops, drive minutes, load and status. The heavy ones (load ≥85) are counted at 11; the delayed ones show why: six stops and 140 minutes of drive on a 97 load is a day that was never going to fit.
Stops, drive minutes and load per route
Planned, active, done, delayed chips
4,234 total drive-minutes across the view
field screen-3
28 technicians, two kinds of busy
Utilization and travel are separate columns, so the overtime-risk column can be honest: 59% average utilization with 32% of the day in vans, 7 overloaded at util ≥85 or in OT, and 12 with room to pull capacity from.
Util % and travel % as separate columns
OT risk ≠ utilization. The table proves it
Available through OT as status chips
field screen-4
Product tour
Four screens, captured from the running build.
Not a mockup and not a concept deck. This is what opens at /app/field.
field.cedxsystems.com
01 Overview
The day, with its exceptions named
Dispatch health reads 63: 225 open, 45 clocks tight, 7 overloaded. The alerts carry causes: a callback at FTF risk 86 with skill match 55% and two parts missing; a van stock-out blocking two open jobs; a critical SLA under one hour with skill match 70%.
Three critical jobs already at 0.0h of SLA
A tech at 52% utilization flagged “pull capacity”
Job status: 59 en route · 56 held · 42 done
02 Jobs
The work, riskiest first
Three hundred twenty jobs with 225 open, 116 at high FTF risk and 42 inside two hours of SLA. Sorting by risk puts callbacks on top: the repair that failed yesterday is the row most likely to fail today.
60 callbacks typed in the catalog
Held is a status with 56 jobs in it
Search by job, title, tech or site
03 Routes
The day as driven, not as drawn
Sixty routes with dates, technicians, zones, stops, drive minutes and load. Two delayed routes sit at loads of 97 and 95. The difference between a plan and a wish is printed in the load column.
11 heavy routes at load ≥85
West route: 7 stops, 212 drive-minutes, load 99
Delayed is a state with its own chip
04 Technicians
Capacity you can argue with
Twenty-eight technicians with status, zone, utilization, travel, today's jobs, open jobs and OT risk. The travel column reframes the roster: a tech at 48% utilization and 45% travel is not idle. He is driving.
Average utilization 59% · travel 32% of day
12 techs at full capacity headroom
OT risk per tech, 94 at the top
Who runs it
Three roles keep the day honest.
Roles, not references. We have no named customers yet, so nobody in these photographs is quoted, credited or claimed as one.
Field technician
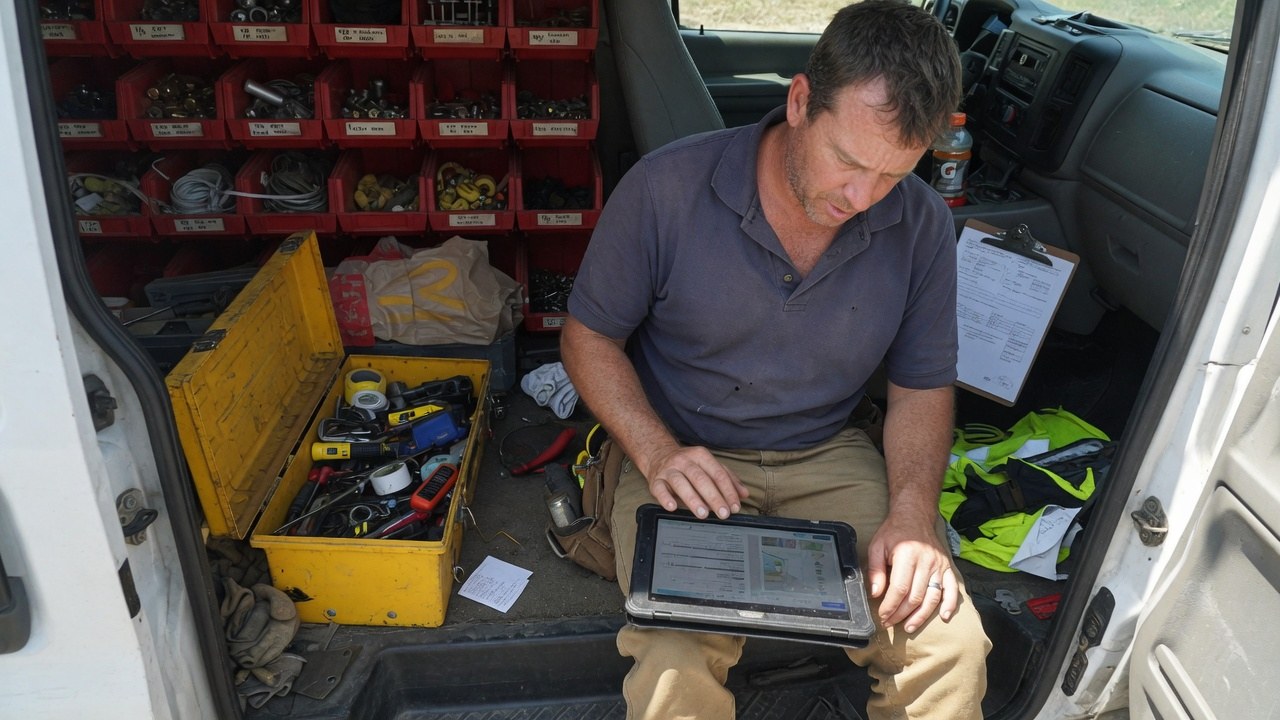
Lives in the route: stops, drive time, van stock. The 32% travel column is his day, and the parts bins in the photograph are why stock-outs block jobs.
travel · 32% of day
Dispatcher
Owns the 63 dispatch score: 225 open, 45 clocks tight, 7 overloaded, and keeps the board honest when the day goes sideways.
open · 225
Service operations lead
Watches first-time fix and the callback catalog. Sixty typed callbacks do not argue back.
FTF · 78.6%
The shape of it
What the demo workspace actually looks like.
Every figure below is legible in the captures above. Nothing here is a projection of your estate. It is the state of the demo data.
225open jobsof 320 in the day view
45SLA clocks tight3 criticals already at 0.0h
42parts stock risks on vansone stock-out blocking 2 jobs
7overloaded techsutil ≥85 or in overtime
Jobs by status: 320 in the dayheld is a queue too
En route59
Held56
Scheduled55
On site55
Cancelled53
Done42
First-time fix, trailing 60 daysthe other 21.4% is a second truck roll
Fixed first time · 78.6%
Callbacks · 60 typed in the catalog
Open jobs by prioritycritical 47 · high 75 · normal 62 · low 41
47
Critical · 47
High 75 · normal 62 · low 41
How it runs
A job's life, in the order it actually happens.
01
Book
Jobs arrive typed (callback, repair, install) with SLA clocks already running; 42 have under two hours left.
02
Stock
Van stock is part of dispatch: one missing IR module on one van is blocking two open jobs today, and the alert says which van.
03
Route
The day becomes 60 routes with drive minutes and load scores; 11 run heavy at ≥85 and two are already delayed.
04
Close
First-time fix is the scoreboard (78.6% trailing 60 days), and every return visit is typed as a callback, so the list leads tomorrow's risk sort.
One record
The job ends on site. The record does not.
Dispatch touches money, machines and the queue. The estate keeps those in one place: same day, same Ask AI button.
Finding this out on the third call is worse for you than reading it here, and worse for us.
Field is not generally available. What opens today is the live build on demo data. Northline Field East is the demo region, and its techs, vans and sites are demo rows.
FTF risk and OT risk are scores to dispatch by, not guarantees. A 99 can still go right, and the demo shows the signals (skill match, parts) behind the score.
Drive minutes and load scores are the demo day's figures, not routing benchmarks for your geography.
What the screens show is the plan and its exceptions. We do not claim live traffic feeds or automatic re-routing on this page.
No audit or compliance certification has been issued. What we can evidence about hosting and access is on the security page.
Yes. Every screenshot is a capture of the running build, open at /app/field. It runs on demo data. The region on the chrome is the demo tenant’s.
What is FTF risk?
A first-time-fix probability per open job, 116 of them currently at ≥55. The alerts show the inputs: skill match percentage, parts missing, callback history. The riskiest rows are typed callbacks: work that already failed once.
Why do callbacks top the risk list?
Because the data says they should: the first fourteen rows of the risk sort are all callback jobs at 95 to 99. A return visit carries the original fault's uncertainty plus the customer's patience spent.
What does the overtime-risk column read?
Not utilization. The technicians table shows a tech at 48% utilization with OT risk 91 because travel is 45% of his day. Busy and overloaded are separate columns on purpose.
Is Field audited or certified?
No certification has been issued. What we can evidence about hosting, encryption and access is on the security page.
Tomorrow's risk is on today's board.
Live build, demo data, no card. Then count your callbacks. They are already at the top of the list.