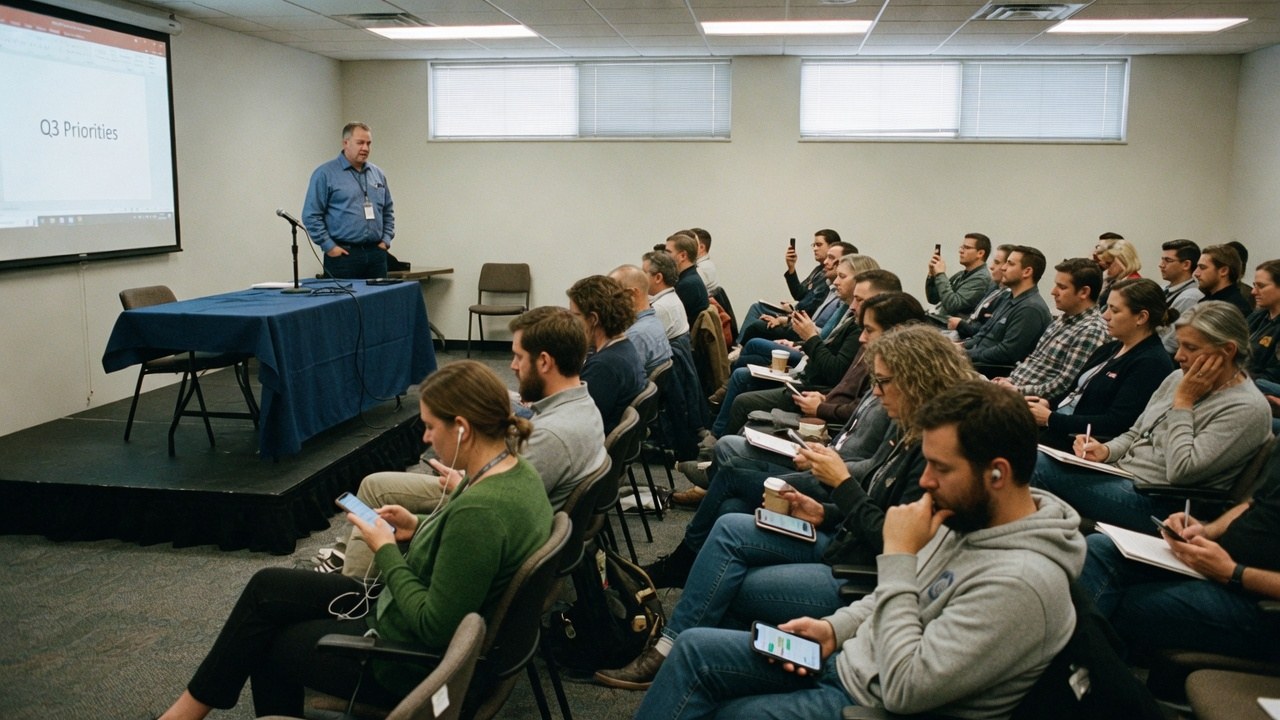
An all-hands room during a quarterly priorities talk, half the audience checking their phones — the people behind engagement numbers.

CEDX Engagement · Product engagement

Every user scored.
Every change explained.

Engagement scores product usage the way a finance team scores cash: a composite 0–100 per user, bands from Champion to Dormant, sessions with depth and outcome — and a monitoring digest that attaches a cause and a next step to every metric that moved.

The digest does not say “score down 2.1”. It says the ingest lagged 18 minutes, skewing the recency component — and to pause score-cliff alerts for 24 hours. A cause and a next step, or it is not an alert.

engagement.cedxsystems.com — live build
CEDX Engagement overview: 58.2 average engagement score, 24.6K active users, 41.2K sessions a day, 4.8% campaign conversion and 42.1% stickiness.

Runs on demo data. The workspace labels itself Harbor Production · score lag ~2m · demo seed.

24.6K active users scoredcomposite 0–100 · average 58.2
41.2K sessions a day4.5 screens deep on average
3.8K users at riskband plus churn signals · plays attached

What it is

Scores, bands, and the digest that investigates.

Bands that decide the play

Twenty-four thousand six hundred users sorted into Champion 3,420, Engaged 6,840, Passive 7,920, At risk 3,960 and Dormant 2,460 — with a high-LTV at-risk list that pairs each score with the value it protects, down to a score of 7 against 16K.

  • Five bands, counted on screen
  • High-LTV at-risk list: score beside value
  • Stickiness 42.1% WAU/MAU, trailing

engagement — overview
Bands that decide the play

Every user a row, every row a sparkline

Three hundred twenty seeded users with score, band, plan, session count, last-active and a 30-day sparkline per row. Champions average 52.3 across the workspace; eighty-six sit at risk or dormant with “need play” attached.

  • 41 champions in the seeded ledger
  • Filter by band and by plan tier
  • Session counts up to 66 per user in view
engagement — screen-3
Every user a row, every row a sparkline

Sessions with an outcome

Four hundred twenty sessions with duration, depth, channel and outcome per row — 19 minutes, 13 screens, desktop, converted. One hundred seventy-three ended engaged or converted: 41% of the view.

  • Average 9m 41s · 4.5 screens deep
  • Channels: Web · iOS · Android · Desktop
  • Outcomes: Engaged · Browsed · Converted · Bounced
engagement — screen-4
Sessions with an outcome

Product tour

Three screens, captured from the running build.

Not a mockup and not a concept deck. This is what opens at /app/engagement.

engagement.cedxsystems.com
CEDX Engagement Overview screen.CEDX Engagement Users screen.CEDX Engagement Sessions screen.

01 — Overview

The engagement brief, with causes

Score and sessions trend across the quarter while the watched-metrics digest investigates what moved: a silent-14-day cohort up 48 users traced to trial day-5 inactivity; win-back conversion up 0.6 points traced to a subject-line variant, with “promote to 100%” as the next step.

  • Ask anything panel labelled deterministic demo
  • Campaign convert 4.8% across channels
  • At-risk count down 210 this period

02 — Users

The ledger behind the score

Search by id, email, name or company across the seeded users. A champion at 97 with 66 sessions reads beside one at 91 on a free plan — band and plan are separate columns, so value and usage never blur.

  • 320 users · average score 52.3
  • 30-day sparkline per user
  • CSV of the filtered ledger

03 — Sessions

What a visit actually did

Sessions list duration, depth, channel, outcome and score, with the moment they started. Converted sessions at 19-plus minutes sit beside bounced ones — depth and outcome are the columns the bands are built from.

  • 420 sessions · 41% engaged or converted
  • Depth to 13 screens in view
  • Filter by channel and outcome

Who runs it

Three roles read the score.

Roles, not references. We have no named customers yet, so nobody in these photographs is quoted, credited or claimed as one.

Lifecycle marketer

Runs the plays the digest recommends: promote the win-back variant, route revoked push users into the email re-permission series.

convert 4.8% · +0.6pp win-back

Product manager

Reads the bands against the roadmap — the boards tip lifting Passive-band depth is why champion share is up 0.8 points.

champion share +0.8pp

Product analyst

Works the digest: every moved metric needs a cause and a next step before it reaches the weekly review.

5 watched metrics · causes attached

The shape of it

What the demo workspace actually looks like.

Every figure below is legible in the captures above. Nothing here is a projection of your product — it is the state of the demo seed.

58.2average engagement score0–100 composite · score lag ~2m
24.6Kactive usersscore ≥40 · +3.2%
42.1%stickinessWAU over MAU · +0.8pp
3.8Kusers at riskband plus signals · down 210
Users by engagement bandworkspace scale · overview bands
  • Passive7,920
  • Engaged6,840
  • At risk3,960
  • Champion3,420
  • Dormant2,460
Sessions engaged or converted173 of 420 sessions in view
  • Engaged + Converted · 173
  • Browsed + Bounced · 247
StickinessWAU / MAU · trailing
42.1%
  • Weekly actives · 42.1% of monthly
  • +0.8pp this period

How it runs

A score's life, in the order it actually happens.

01

Score

Sessions roll into a composite 0–100 per user — the demo seed runs with a two-minute lag, printed on screen.

02

Band

Scores sort users from Champion to Dormant, so the play is chosen by band, not by hunch.

03

Investigate

The watched-metrics digest attaches a cause to every change — ingest lag, a variant, a feature tip — before anyone acts on it.

04

Play

Next steps are specific: boost the trial day-3/5 drip, promote variant B to 100%, extend the boards tip to all Passive workspaces.

One record

The plays run in
the estate's other products.

Engagement scores the users; the campaigns and journeys that move the score live next door.

All 132 applications

Limits

What Engagement does not do yet.

Finding this out on the third call is worse for you than reading it here, and worse for us.

Start

Open it before you talk to anyone.

Pilot

Your events, your bands

  • Everything in Try
  • Score-definition workshop
  • Band and play design
  • Estate map
Talk to sales

Estate

Engagement with the rest of it

  • Engagement with Campaigns, Journeys and CRM
  • One identity, one bill
  • CEDX delivery
Book an estate map

Questions

Before you pilot Engagement.

Is the software on this page real?

Yes. Every screenshot is a capture of the running build and you can open the same build at /app/engagement. It runs on a demo seed, which the workspace labels on screen.

Is this employee engagement?

No. The captures are unambiguous: this scores product usage — sessions, depth, bands, plays. Staff-side engagement in this estate runs through People and Performance.

How is the score computed?

A 0–100 composite over seeded session, campaign and churn signals, with the lag printed on screen. The digest shows the components moving — recency, depth, campaign response — rather than hiding them.

What are plays?

The next step attached to a watched metric: promote the winning win-back variant, route push-revoked users into the email re-permission series, extend a feature tip to all Passive-band workspaces.

Is Engagement audited or certified?

No certification has been issued. What we can evidence about hosting, encryption, tenant isolation and production access is written up on the security page.

The scoreboard is running. Go and look at it.

Live build, demo seed, no card. Then ask what your own silent-14-day cohort looks like this week.