 CEDX
CEDX


Webinars
Live sessions on the real product
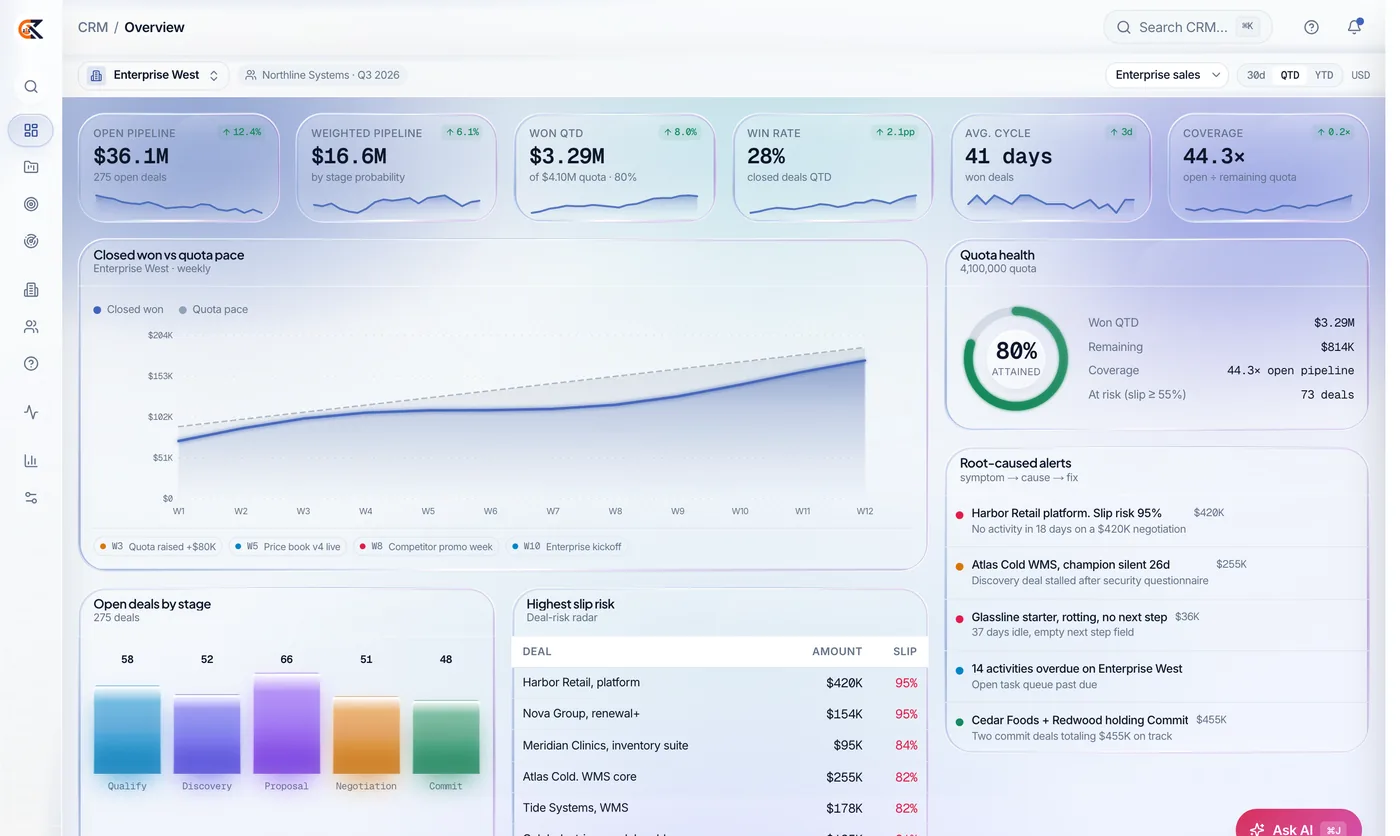
Public webinars and partner labs that end in the running app, not slide-only theatre.

Format contract
If we cannot open the app, we do not run the session
Public webinars are forty-five to sixty minutes: context, live product walkthrough, Q and A. Office hours are lighter. Partner labs are hands-on in demo tenants. Private customer sessions follow the estate map.
Recordings of public sessions usually publish within a week. Partner labs stay in the partner portal. Registration email is enough for public seats; you do not need a full CEDX account to watch.
Who should attend
Operators and evaluators, not badge collectors
Bring the people who will own the queue after go-live. Marketing-only audiences without operators rarely convert a webinar into a clean pilot.
Partners use enablement labs for demo certification. Customers use product sessions to pressure-test whether the live build matches the story on the product page.
Webinars purpose
What webinars is for
Webinars exists as part of the CEDX resource library next to Academy, product pages, and customer scenarios. Content stays operator-grade and tied to live software wherever a product claim is made.
Use this surface when its job matches your moment: learning, release notes, live sessions, listings, or essays. Do not expect one page to replace the whole estate evaluation path.
Editorial and product truth rules still apply: no parallel mockup universe, no thin listicles, no bait-and-switch demos. If a session or essay points at a product, open the live app and test the claim.
Partners and customers share public surfaces; partner-only depth remains in the portal after approval. That split keeps evaluation open without giving away co-sell assets.
How to use it
Practical path
Start from the hero metrics and section map, then deep-link into product catalog or Academy as needed. Bring operators when decisions depend on queue design rather than feature checkboxes alone.
Capture decisions in your pilot doc or joint plan so sessions and essays produce artifacts. Without artifacts, content becomes entertainment.
Escalate to contact for estate map, partner intro, or private sessions when public material is not enough. Include industry, products, timeline, and constraints so routing is correct.
Related hubs always include Customers, Partners program, Developers, and Support where relevant. The estate is one system; the library is one map.
Standards
Quality bar
Live product when product is claimed; honest illustrative language for scenarios; written FAQs for procurement paste. Security and identity questions get real answers or a path to the security pack.
No paid directory ranking; no calendar filler essays; no webinars that cannot open the app. Violations are process bugs we fix rather than exceptions we normalize.
Accessibility and clarity beat cleverness; operators should finish a section with an action. If a section has no action, it is incomplete.
Refresh cadence follows product change, not an arbitrary publishing calendar. Material changes may appear in News when they affect programmes.
Next step
Leave with an action
Pick one product to open live, one Academy module or scenario to read, and one conversation to book if needed. Three actions beat thirty open tabs.
Share links with the people who own the queue so evaluation is not stuck in a single inbox. Estate programs fail when only one champion understands the map.
Partners: complete enablement and clean portal hygiene before promising Premier outcomes internally. Customers: write the retire list before config week one.
When ready, use contact with context both sides can act on within two business days for most intro and map requests. Serious inputs get serious routing.
Upcoming themes
What we cover
CRM for services firms
Pipeline hygiene and forecast discipline.
Desk + Field in one ticket
Intake to truck roll.
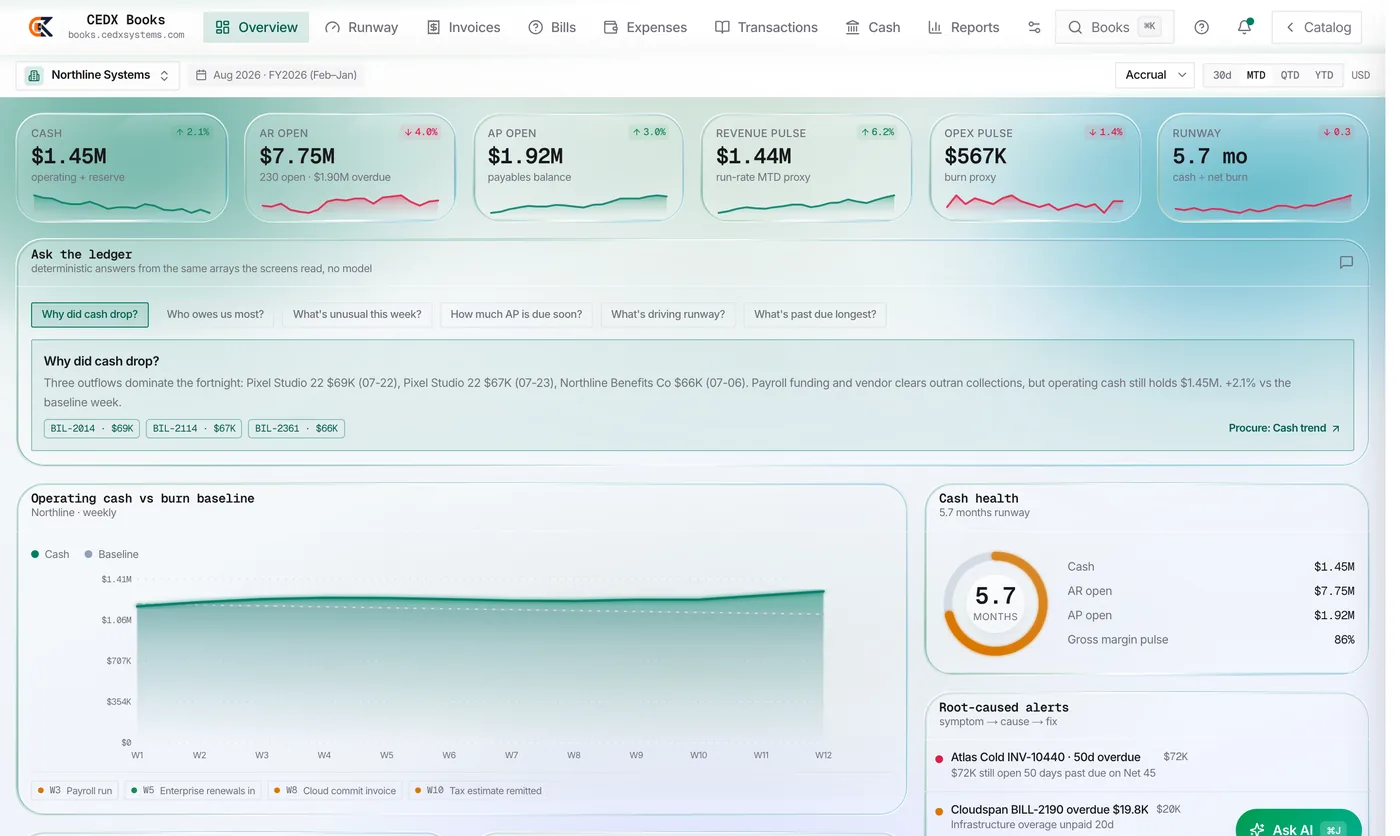
Month-end on Books
Close checklist walkthrough.
Partner enablement lab
Registered partners, demo certification.
Estate security basics
Identity, access, audit for admins.
Marketplace sellers
Catalog and payouts without chaos.
Formats
How sessions run
Public webinar
45-60 min, live product, Q&A.
Office hours
Bring a question; lighter agenda.
Partner lab
Hands-on in demo tenants.
Customer private
Scoped to your estate map.
Audience paths
Pick a seat with intent
Evaluating CEDX
Product sessions that end in the live app. Bring operators.
In-pilot teams
Office hours and close/service deep dives.
Partners
Enablement labs and demo certification.
Builders
API and Marketplace extension sessions.
After the session
What we expect you to leave with
Decision log
What you will try in the next two weeks.
Product links
Direct URLs to the live apps shown.
Follow-up
Estate map or partner intro if requested.
Recording
When public, link by email within a week.
On stage
Show the product, not only the deck
If we cannot open the app, we do not run the session.
FAQ
Webinars: practical questions
Straight answers before you book time or open a ticket.
Are recordings public?
Most public sessions yes within a week. Partner labs stay in the portal.
Do I need an account?
Registration email is enough for public sessions.
Can we get a private session?
Yes for customers on an estate map path; request via contact.
Do partners get different labs?
Yes. Enablement labs and demo certification live under partner events after approval.
Put this into practice
Open the relevant product, bring the operating question, and leave with a named next action.