965 lines booked this month, $38K waiting on approval, 150 policy flags and 64 missing receipts. The overview reads like the month-end conversation you were going to have anyway, except it is already priced.
120 receipts in the queue37% match rate · 32 missing worth $19K
47 anomalies on the board24 critical covering $72K
What it is
Three screens between a receipt and the ledger.
Every line gets a risk score
208 lines scored with the formula on screen: amount × risk% = expected dollars. Lumen Telecom at $2.5K and 86% risk expects $2.1K of violation; the policy column says Block or Flag, and the ≥55% / ≥70% chips cut the board down to what needs a person.
42 lines at ≥55% risk worth $30K
Expected violation $50K across the board
Owner, category and policy on every row
expenses screen-2
Anomalies with a reason attached
47 signals, each named by shape: suspect document, merchant spike, late or high-fare travel. Each row carries a deviation percentage (84% off peer for a suspect Beacon Legal document, 71% for a Printfly merchant spike), so the queue sorts by how strange, not how recent.
24 critical anomalies covering $72K
Deviation % printed on every row
Peer · merchant · fare · docs signal types
expenses screen-3
Receipts matched, suspect docs held
120 receipts in the demand queue with a 37% match rate. Nine suspect documents worth $5.3K are held for forensics, and the authenticity column says why: “Reviewed · edit metadata” on one, “Suspect · edit metadata +1” on another.
32 receipts missing worth $19K
Matched · Missing · Partial · Suspect chips
Source (card, cash, reimburse) on every row
expenses screen-4
Product tour
Four screens, captured from the running build.
Not a mockup and not a concept deck. This is what opens at /app/expenses.
expenses.cedxsystems.com
01 Overview
The month's spend, priced
MTD spend $21K across 965 lines, $38K pending approval over 51 reports, 150 policy flags of which 42 are high-risk. Alerts arrive priced: Beacon Legal blocked at $3.2K for a hard-block without PO, and 49 approvals past the 5-day SLA holding $28K.
Policy health score 48 on the ring
64 missing receipts · 37% match rate
Spend by category: travel $33K leads the book
02 Policy risk
The board approvers actually work
Risk board 208, sorted by expected dollars. The top rows are blocks, not warnings: Lumen Telecom travel at 86%, Printfly at 85%, Beacon Legal professional services at 79%. Two simulation levers show $24K of expected loss and $25K saved against baseline.
Expected $ = amount × risk%, on screen
Block and Flag policies per line
Risk board · policy levers · scoring model tabs
03 Anomalies
What does not fit the pattern
Suspect documents, merchant spikes and late high-fare travel, each with owner, department, deviation and amount. The heaviest cluster is suspect documents in Sales at 70 to 84% deviation, the kind of thing a spot-check finds a quarter late.
47 anomalies · $185K volume covered
Critical and Watch severity chips
Board · deviation ranking · detection model tabs
04 Receipts
The paper trail, chased
The receipt queue shows why the match rate is 37%: City Parking at $42 missing twice, a $987 Willow Cowork receipt matched but reviewed for edited metadata, partial matches on Skyline Airlines and Fleet Card Co. Age runs to 17 days on the oldest.
120 receipts · 32 missing · $19K
9 suspect documents held, $5.3K
Age in days on every row
Who runs it
Three roles keep spend honest.
Roles, not references. We have no named customers yet, so nobody in these photographs is quoted, credited or claimed as one.
The employee
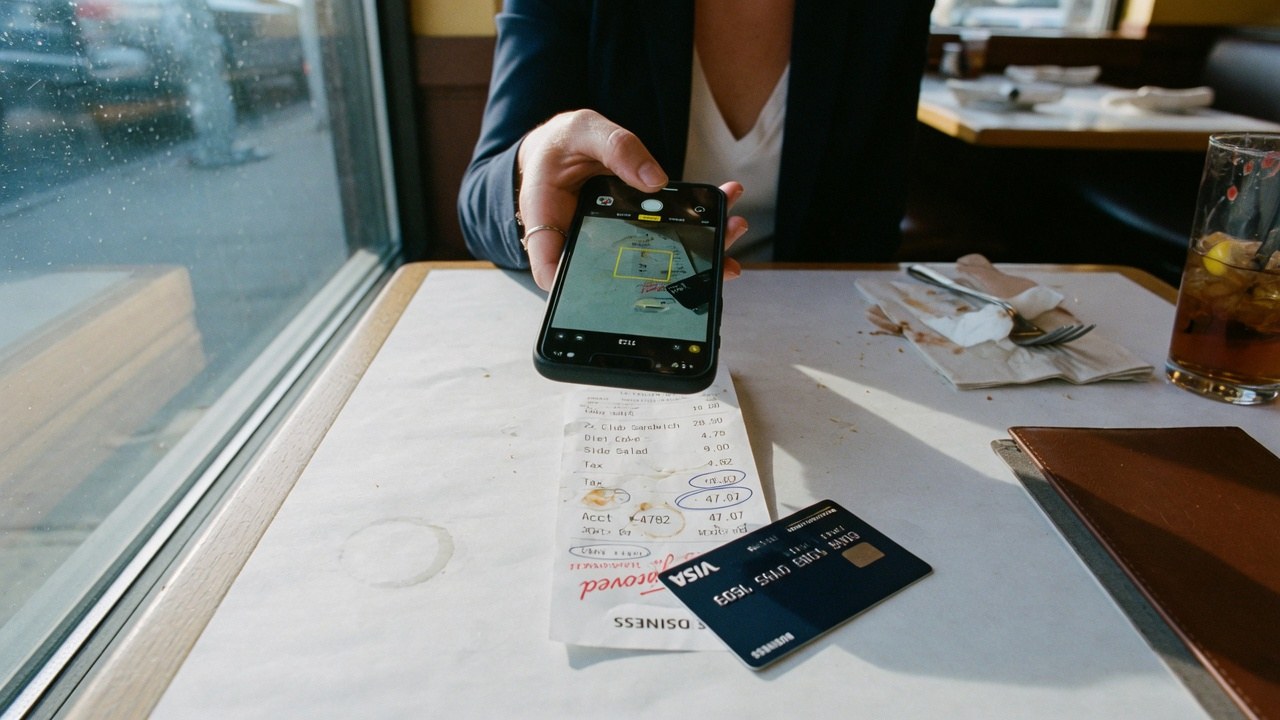
Photographs the receipt at the table and is done. The matching, chasing and awkward reminder emails happen in the queue, not at dinner.
37% match · 32 missing
The approver
Works the 49 approvals past SLA from a board that already knows the risk score, the policy and the expected dollars, instead of a thread of forwarded PDFs.
51 reports · $38K pending
Finance operations
Owns the anomaly board and the suspect-document hold pile, and answers for the policy health score at month-end.
47 anomalies · 9 docs held
The shape of it
What the demo workspace actually looks like.
Every figure below is legible in the captures above. Nothing here is a projection of your estate. It is the state of the demo data.
$21KMTD spend965 lines booked
$38Kpending approval51 reports · 49 past the 5d SLA
150policy flags42 high-risk · $30K at ≥55%
37%receipt match rate120 in queue · 32 missing · $19K
Spend by categoryall sources · $K · from the overview capture
Travel$33K
Professional$28K
Facilities$23K
Lodging$22K
Hardware$22K
Training$21K
Software$18K
Marketing$11K
Receipts matched37% matched share of 120 in the queue
Matched · 37%
Missing or partial · 63%: the chase list
Policy healthcomposite score · printed on the overview
48
Clear share of the book
150 flagged lines · 64 missing receipts
How it runs
An expense line's life, in the order it actually happens.
01
Capture
Spend lands by card or reimbursement. The overview plots both paces side by side so a reimbursement bulge is visible before it becomes a backlog.
02
Score
Every line is scored against policy: amount × risk% = expected dollars. Blocks stop, flags queue, and the reason rides on the row.
03
Chase
Missing receipts become a demand queue with age in days; 32 are outstanding worth $19K, and suspect documents are held rather than paid.
04
Clear
Approvals clear from a board that shows risk and policy together: 49 are past the 5-day SLA right now, priced at $28K so the cost of waiting is visible.
One record
The same merchants, the same money.
One demo workspace means the merchant names and amounts on these expense lines are the same ones the rest of the finance apps see: no second truth to reconcile against.
Finding this out on the third call is worse for you than reading it here, and worse for us.
Expenses is not generally available. What opens today is the live build running on demo data; the 965 lines and their merchants are the demo book, not your estate.
We have no named customers to show you, so this page shows none. Northline Systems in the captures is the software's demo workspace, not a reference.
The risk score's inputs are visible as a scoring-model tab; we are not claiming it catches fraud, only that it ranks the demo book the way you see.
Suspect-document detection flags edited metadata, as shown on the receipts screen. We are not claiming forensic certainty. The hold pile is a queue for a person, not a verdict.
No audit or compliance certification has been issued for Expenses. What we can evidence about hosting, encryption and access is on the security page.
Yes. Every screenshot is a capture of the running build and you can open the same build at /app/expenses. It runs on demo data.
What does the risk score actually compute?
What the screen says: amount × risk% = expected dollars. The inputs sit on a scoring-model tab next to the board, and the two simulation levers show the expected loss moving from $50K to $24K against a $25K baseline saving.
What counts as an anomaly?
Four named shapes, visible on the board: suspect document, merchant spike, late or high-fare travel, and peer-group deviation. Each row prints its deviation percentage. The queue sorts by how strange a line is, not when it arrived.
Why is the receipt match rate only 37%?
Because that is the state of the demo book, and the screen shows it instead of hiding it: 120 receipts in the queue, 32 missing worth $19K, 9 suspect documents held. Your number would be your own; the demo's job is to show the mechanics.
What happens to a suspect document?
It is held, not paid. The receipts screen shows nine documents worth $5.3K in the forensics hold, with the authenticity column recording why. Edited metadata is called out explicitly.
Is Expenses audited or certified?
No certification has been issued. What we can evidence about hosting, encryption, tenant isolation and production access is written up on the security page.
The queue is live. Go and look at it.
Live build, demo data, no card. Then count your own missing receipts and compare the view.